. 2011 Jan 13;69(1):44-60.
doi: 10.1016/j.neuron.2010.11.042.

Functional architecture of olfactory ionotropic glutamate receptors

Affiliations

Functional architecture of olfactory ionotropic glutamate receptors

Liliane Abuin et al. Neuron. .

Abstract

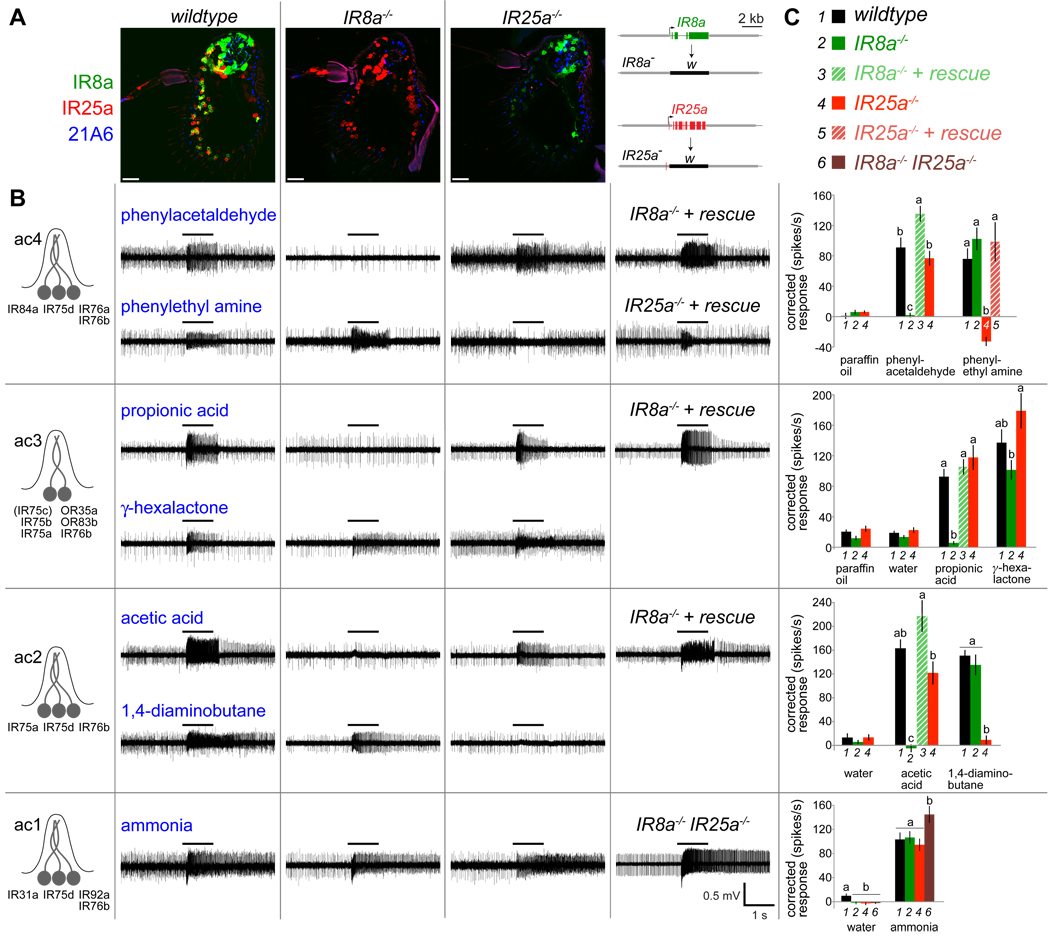
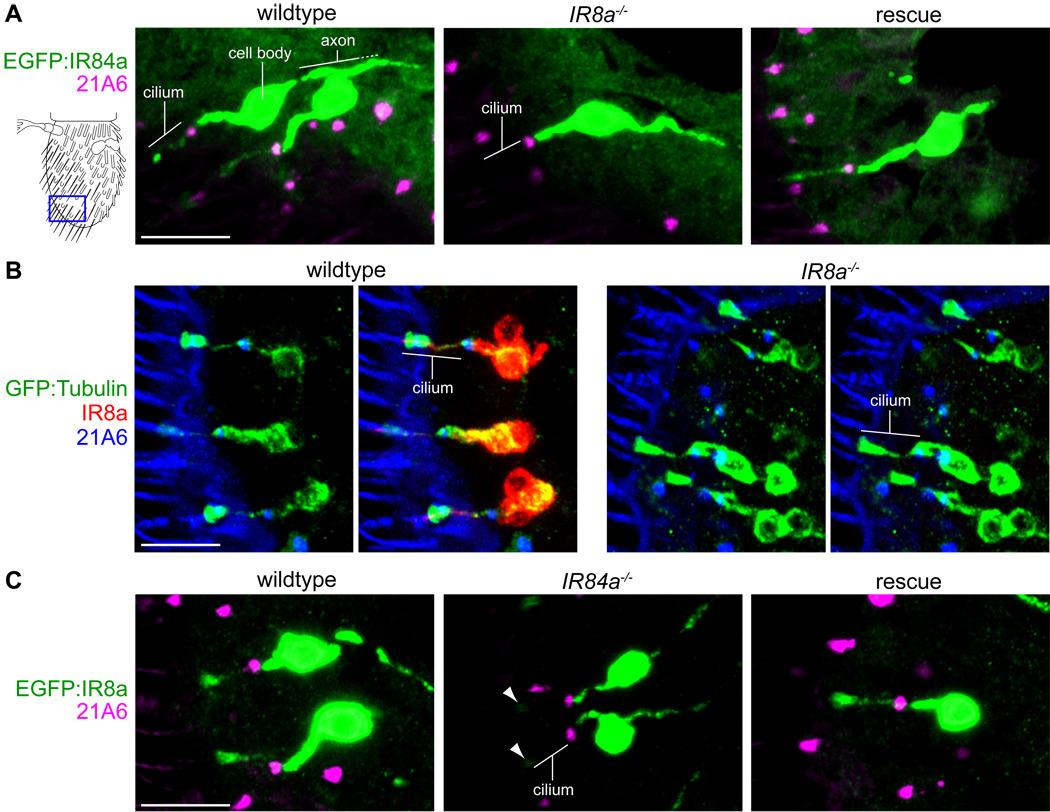
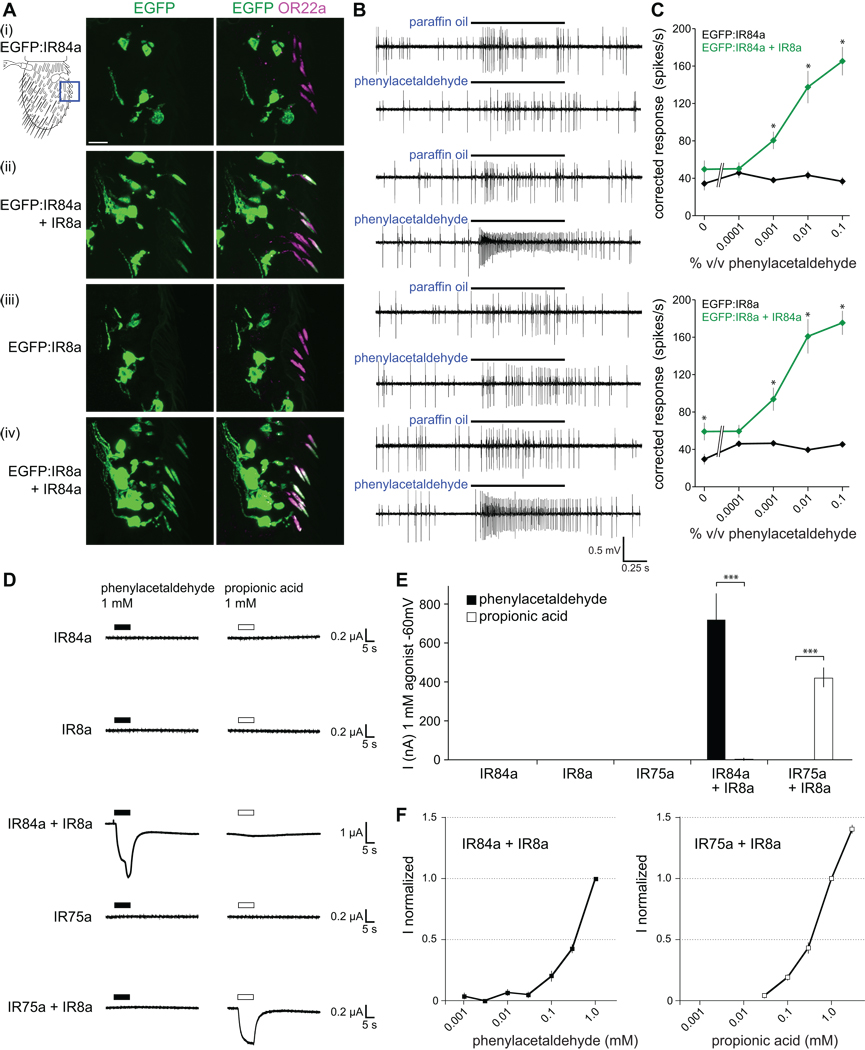
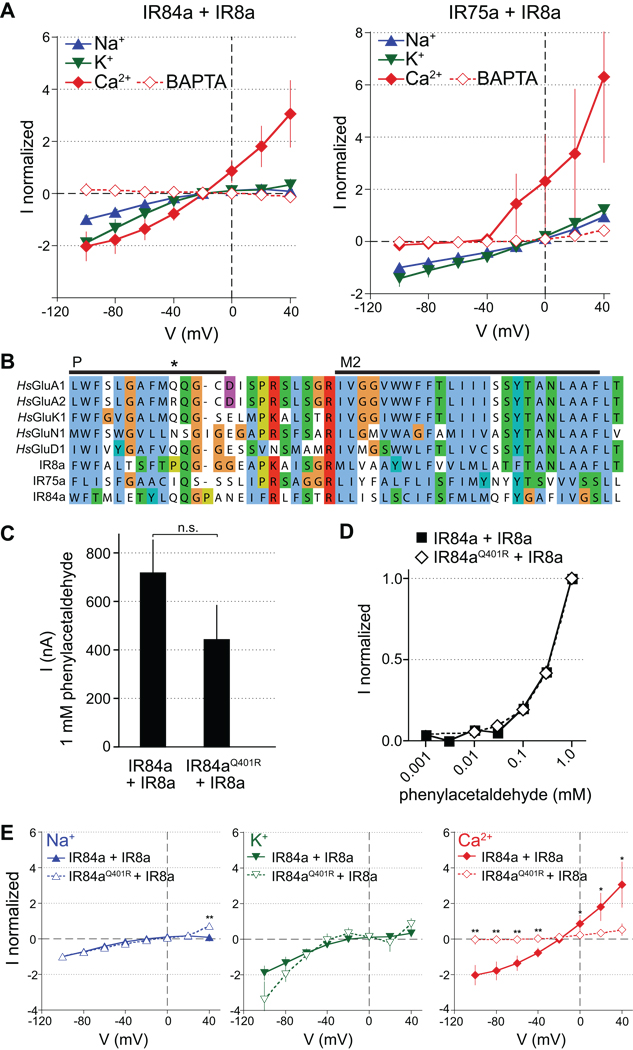
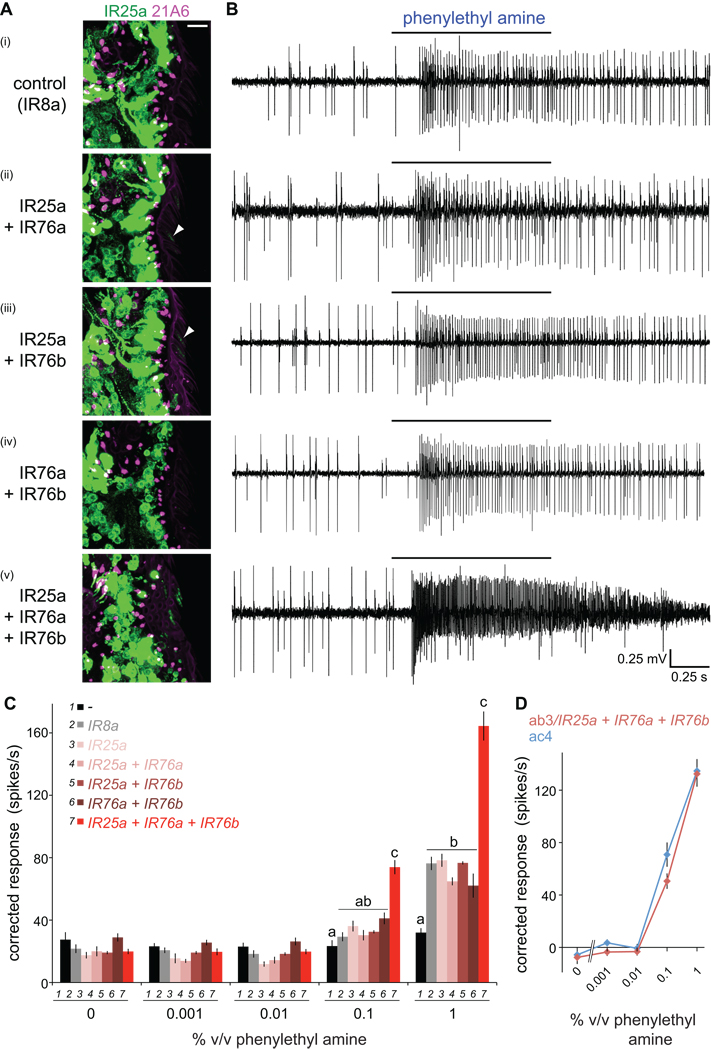
Ionotropic glutamate receptors (iGluRs) are ligand-gated ion channels that mediate chemical communication between neurons at synapses. A variant iGluR subfamily, the Ionotropic Receptors (IRs), was recently proposed to detect environmental volatile chemicals in olfactory cilia. Here, we elucidate how these peripheral chemosensors have evolved mechanistically from their iGluR ancestors. Using a Drosophila model, we demonstrate that IRs act in combinations of up to three subunits, comprising individual odor-specific receptors and one or two broadly expressed coreceptors. Heteromeric IR complex formation is necessary and sufficient for trafficking to cilia and mediating odor-evoked electrophysiological responses in vivo and in vitro. IRs display heterogeneous ion conduction specificities related to their variable pore sequences, and divergent ligand-binding domains function in odor recognition and cilia localization. Our results provide insights into the conserved and distinct architecture of these olfactory and synaptic ion channels and offer perspectives into the use of IRs as genetically encoded chemical sensors.


Figures

Figure 1
Figure 1. Phylogenetic relationships and broad antennal expression of IR8a and IR25a
(A) Phylogenetic tree of Drosophila iGluRs and IRs. Protein sequences were aligned using MUSCLE, and the tree was calculated with PhyML and visualized in FigTree v1.1.2 (adapted from (Croset et al., 2010)). The scale bar indicates the expected number of substitutions per site. A schematic model of the iGluR/IR structure is shown in the cartoon at the top right. (B) Schematic of the Drosophila third antennal segment illustrating the different classes of olfactory sensilla and other sensory structures. (C) Immunostaining on a wildtype antennal section with IR8a (green), IR25a (red) and cilium base marker 21A6 (blue) antibodies. IR8a is detected in ciliated dendritic endings (distal to 21A6) both in coeloconic sensilla (arrowheads) as well as in neurons projecting into the sacculus chamber (asterisk). The scale bar represents 20 µm.
Figure 2
Figure 2. IR8a and IR25a are essential for odor-evoked electrophysiological responses in multiple distinct neuron classes
(A) Immunostainings on antennal sections from wildtype (left), IR8a1 mutant (middle) and IR25a2 mutant (right) flies with IR8a (green), IR25a (red) and 21A6 (blue) antibodies. The scale bars represent 20 µm. Schematics of gene-targeted IR8a and IR25a null alleles, where the IR coding region is replaced with the white (w) reporter gene, are shown at the far right. (B) Left: Schematic of IR expression (excluding IR8a and IR25a) in the four classes of coeloconic sensilla (ac1–ac4) (after (Benton et al., 2009)). Right: Representative traces of extracellular recordings of neuronal responses in the four coeloconic sensilla classes in wildtype (first column), IR8a1/Y hemizygous mutant (second column), IR25a2 mutant (third column), and rescue or IR8a1/Y; IR25a2 double mutant (fourth column) flies, stimulated with the indicated odors. Bars above the traces mark stimulus time (1 s). Genotypes for rescue experiments: “IR8a−/− + rescue”: IR8a1/Y;IR8a-GAL4/UAS-IR8a, “IR25a−/− + rescue”: IR25a2,IR25a-GAL4/IR25a2,UAS-IR25a. (C) Quantification of mean neuronal responses to different odor stimuli in ac1–ac4 sensilla (± s.e.m; n=11–18 (ac4), n=8–16 (ac3), n=5–8 (ac2), n=10–13 (ac1); male flies, ≤3 sensilla/animal) in the genotypes shown in the key at the top and as detailed in (B). Paraffin oil and water are solvent controls. For individual stimuli in each sensilla, bars labeled with different letters are significantly different. ac4: phenylacetaldehyde ANOVA p<0.0001, phenylethyl amine ANOVA p<0.0001; ac3: propionic acid ANOVA p<0.0001, γ-hexalactone ANOVA p>0.011; ac2: acetic acid ANOVA p<0.0001; 1,4-diaminobutane ANOVA p<0.0001; ac1: water ANOVA p>0.0097, ammonia ANOVA p>0.022. Small, but statistically significant, variations in spike responses were observed to some odors in certain mutant backgrounds, for example ac3 γ-hexalactone responses. Although we cannot exclude a modulatory role of IR8a or IR25a in detection of these stimuli, we believe that these effects are likely to be indirect, either because of physiological changes in neighboring neurons in the same sensilla that rely absolutely on these receptors and/or technical difficulties in consistently comparing odor-evoked spike frequencies in sensilla lacking the activity of one or more neurons with those in wildtype sensilla.
Figure 3
Figure 3. Reciprocal requirement of ligand-specific and co-receptors for sensory cilia localization
(A) Immunostaining for EGFP:IR84a (anti-GFP, green) and the cilium base (21A6, magenta) in IR84a neurons in wildtype (left), IR8a mutant (middle) and IR8a rescue (right) antennae. The cartoon at the left schematizes the region of the antennae shown in these and subsequent panels. Antennal sections from at least 20 flies, from at least two independent genetic crosses, were examined for each genotype in this and all other immunofluorescence experiments. Cilia localization of EGFP:IR84a was never observed in IR8a mutant neurons. The scale bar represents 10 µm. Genotypes: IR84a-GAL4/UAS-EGFP:IR84a (left), IR8a1;IR84a-GAL4/UAS-EGFP:IR84a (middle), IR8a1;IR84a-GAL4,UAS-IR8a/UAS-EGFP:IR84a (right). (B) Immunostaining for GFP:Tubulin (anti-GFP, green), IR8a (red) and the cilium base (21A6, blue) in IR8a neurons in wildtype (left images) and IR8a mutant (right images) antennae in anterior-distal coeloconic sensilla where IR84a neurons are located. The scale bar represents 10 µm. Genotypes: IR8a-GAL4/UAS-GFP:α1tub84B (left), IR8a1;IR8a-GAL4/UAS-GFP:α1tub84B (right). (C) Immunostaining for EGFP:IR8a (anti-GFP, green) and the cilium base (21A6, magenta) in IR84a neurons in wildtype (left), IR84a mutant (middle) and IR84a rescue (right) antennae. Trace levels of EGFP:IR8a are occasionally detected in the cilia tips of IR84a mutant neurons (arrowheads). The scale bar represents 10 µm. Genotypes: UAS-EGFP:IR8a;IR84aGAL4/+ (left), UAS-EGFP:IR8a;IR84aGAL4/IR84aGAL4 (middle), UAS-EGFP:IR8a/UAS-IR84a;IR84aGAL4/IR84aGAL4 (right).
Figure 4
Figure 4. A pair of IRs is sufficient to reconstitute odor responses in OR neurons and Xenopus oocytes
(A) Immunostaining for EGFP (green) and OR22a (magenta) in OR22a neurons expressing the combinations of IRs shown on the left. Genotypes: (i) UAS-EGFP:IR84a/+;OR22a-GAL4/+, (ii) UAS-EGFP:IR84a/UAS-IR8a;OR22a-GAL4/+, (iii) UAS-EGFP:IR8a/+;OR22a-GAL4/+, (iv) UAS-EGFP:IR8a/UAS-R84a;OR22a-GAL4/+. The cartoon at the top left schematizes the region of the antenna shown in all images. The scale bar represents 10 µm. Approximately 20% of OR22a neurons do not express IR fusion proteins due to incomplete expressivity of the OR22a-GAL4 driver (Dobritsa et al., 2003). (B) Representative traces of extracellular recordings of neuronal responses in OR22a neurons expressing the combinations of IRs shown to the left in (A) stimulated with paraffin oil (solvent control) or phenylacetaldehyde (0.01% v/v). Bars above the traces mark stimulus time (1 s). OR22a neurons reside in basiconic sensilla with two neurons, visible as two distinct amplitudes of action potentials; the larger amplitude corresponds to OR22a neurons (Dobritsa et al., 2003). (C) Concentration-response curves for phenylacetaldehyde in the genotypes shown in (A). Mean responses are plotted (± s.e.m; n=12–13 sensilla; ≤4 sensilla/animal, male flies). Asterisks indicate significant differences between responses in sensilla expressing one or both receptors (EGFP:IR84a versus (vs) EGFP:IR84a+IR8a ANOVA p<0.0003; EGFP:IR8a vs EGFP:IR8a+IR84a ANOVA p<0.014 for paraffin oil, p<0.0015 for phenylacetaldehyde-evoked responses). (D) Representative whole cell current traces recorded at −60 mV with two-electrode voltage-clamp in Xenopus oocytes injected with cRNAs for the combinations of IRs indicated on the left. Currents of IR84a+IR8a-expressing cells often did not return completely to their baseline after phenylacetaldehyde removal, suggesting sustained activation of these receptors after initial agonist exposure or incomplete removal of phenylacetaldehyde from oocyte membranes. (E) Histogram of current amplitudes of IR84a (n=3–4 oocytes), IR8a (n=3–4), IR75a (n=3–4), IR84a+IR8a (nphenylacetaldehyde=86; npropionic acid=4) and IR75a+IR8a (nphenylacetaldehyde=3; npropionic acid=74) induced by 1 mM phenylacetaldehyde and 1 mM propionic acid. Responses of IR84a+IR8a-expressing oocytes to phenylacetaldehyde and of IR75a+IR8a-expressing oocytes to propionic acid are highly significantly different from a non-cognate odor ligand (unpaired t test, *** p<0.0001). (F) Concentration-response curves of oocytes expressing IR84a+IR8a for phenylacetaldehyde (left) and IR75a+IR8a for propionic acid (right) recorded at −60 mV and normalized to the current induced by 1 mM of ligand. Mean responses are plotted (± s.e.m; n=4–5 oocytes, 2–3 stimulations per oocyte).
Figure 5
Figure 5. Heteromeric IR complex formation
(A) Colocalization of endogenous fluorescence of EGFP:IR84a (green) and mCherry:IR8a (false-colored magenta) in OR22a neurons. Genotype: UAS-EGFP:IR84a/+;UAS-mCherry:IR8a/OR22a-GAL4. Autofluorescence of sensilla cuticle is visible in the magenta (but not green) channel. The scale bar represents 10 µm. (B) Concentration-response curves for phenylacetaldehyde in OR22a neurons expressing tagged (UAS-EGFP:IR84a/+;UAS-mCherry:IR8a/OR22a-GAL4, red symbols) or untagged (UAS-IR84a/+;UAS-IR8a/OR22a-GAL4, black symbols) combinations of IR84a and IR8a. Mean responses are plotted (± s.e.m; n=11–16 sensilla; ≤4 sensilla/animal, male flies). Responses are not statistically different at any stimulus concentration (ANOVA p>0.18). (C) Single molecule fluorescence colocalization in membranes of live Xenopus oocytes visualized with total internal reflection fluorescence microscopy. Molecules of EGFP:IR84a and mCherry:IR8a (left) or EGFP:IR84a and mCherry:IR25a (right) were detected as bright fluorescent spots (top), and positions were extracted from intensity peaks (bottom) (see Experimental Procedures); colocalizing EGFP and mCherry spots are displayed as filled circles. The scale bars represent 1 µm. (D) Quantification of colocalization of EGFP and mCherry signals in oocytes expressing the indicated combinations of tagged IRs. Each circle represents the percentage colocalizing fluorescent spots within a fresh, unbleached membrane patch, calcluated as: [number of spots with EGFP and mCherry fluorescence/(number of EGFP spots + number of mCherry spots)] × 100. Each membrane patch contains ~100–800 fluorescent spots and 7–18 patches were analyzed for each combination of receptors. Statistical differences between IR84a+IR8a and IR84a+IR25a colocalization frequency were determined by Student’s t test, *** p<0.0001. (E–F) Example fluorescence intensity traces of colocalizing spots from cells expressing (E) mCherry:IR8a+EGFP:IR84a or (F) mCherry:IR84a+EGFP:IR8a. The magenta and green bars indicate the collection periods of fluorescence emitted (arbitrary units (a.u.)) originating from mCherry and EGFP, respectively. One (top traces) or two (bottom traces) EGFP tags in one spot result in the stepwise bleaching process (black arrows).
Figure 6
Figure 6. Ion conduction properties of IRs
(A) Current/voltage (I/V) relationships of oocytes expressing IR84a+IR8a stimulated with 1 mM phenylacetaldehyde (left) and IR75a+IR8a stimulated with 1 mM propionic acid (right) in extracellular Na+ (blue), K+ (green) or Ca2+ (red) solutions. Currents were measured as the amplitudes at the end of 1500 ms voltage steps from −100 to +40 mV at 20 mV increments. Currents recorded in the absence of agonist were subtracted from the current amplitudes recorded in the presence of 1 mM agonist. For each oocyte, currents were normalized to the current amplitude measured at −100 mV in the Na+ solution. Mean normalized currents are plotted (± s.e.m; n=9–35). Open symbols represent currents in oocytes (in Ca2+ solution) injected with BAPTA prior to the electrophysiological measurements to chelate the entering Ca2+. (B) Sequence alignment of the pore selectivity filter (P) and M2 transmembrane domain for selected human (Hs) AMPA (GluA1, GluA2), Kainate (GluK1), NMDA (GluN1) and Delta (GluD1) subfamily iGluRs and Drosophila IRs. iGluR names follow new nomenclature conventions (Collingridge et al., 2009). The asterisk highlights the Q/R editing site that regulates calcium permeability in GluA2 (Liu and Zukin, 2007). (C) Histogram of mean Na+ current amplitudes (± s.e.m) at −60 mV in oocytes expressing IR84a+IR8a (n=86) or IR84aQ401R+IR8a (n=7) induced by 1 mM phenylacetaldehyde. Responses are not statistically different (unpaired t test, p=0.16). (D) Concentration-response curves for phenylacetaldehdyde of oocytes expressing either IR84a+IR8a or IR84aQ401R+IR8a recorded at −60 mV in extracellular Na+ solution. Currents were normalized to that measured by stimulation with 1 mM agonist. Responses are not statistically different at any stimulus concentration (unpaired t test, p=0.14). (E) I/V relationships of IR84a+IR8a (solid symbols and lines; data reproduced from (A)) and IR84aQ401R+IR8a (open symbols and dotted lines) in extracellular Na+ (blue), K+ (green) or Ca2+ (red) bath solutions. Currents were measured and corrected as described as in (A). Mean normalized currents are plotted (± s.e.m; IR84a+IR8a n=35; IR84aQ401R+IR8a n=8). Statistically significant differences between responses of wildtype and mutant receptors are indicated by asterisks (unpaired Student’s t test, ** p<0.01, * p<0.05).
Figure 7
Figure 7. IR ligand-binding domains function in cilia localization and odor responses
(A–K) Left: Immunostaining for EGFP (green) and OR22a (magenta) in OR22a neurons expressing an EGFP-tagged deletion or site-directed mutant IR in combination with an untagged wildtype IR8a or IR84a partner, as illustrated in the cartoons on the far left. Genotypes are of the form (A–D) UAS-EGFP:IR84aX/UAS-IR8a;OR22a-GAL4/+ or (E–K) UAS-EGFP:IR8aX/UAS-IR84a;OR22a-GAL4/+, where “X” denotes a wildtype or mutant version of the IR fusion protein. The arrowhead in (G) marks the very weak cilia localization of EGFP:IR8a ΔC+IR84a. The scale bar represents 10 µm for all panels. Right: Concentration-response curves for phenylacetaldehyde in OR22a neurons expressing the combination of receptors shown on the left. Mean responses are plotted (± s.e.m; n=12–29 sensilla; ≤4 sensilla/animal, male flies). The responses of corresponding wildtype receptor combinations (panels (A) and (E)) are shown as blue lines in each graph for comparison with mutant receptor responses. Responses were corrected for small, but slightly variable, baseline solvent responses to permit direct comparison of phenylacetaldehyde-evoked activity. Statistically significant differences between responses of wildtype and mutant receptors are indicated by asterisks (Student’s t test, *** p<0.001, ** p<0.01, * p<0.05).
Figure 8
Figure 8. An olfactory receptor of three IR subunits
(A) Immunostaining for IR25a (green) and the cilia base (21A6, magenta) in OR22a neurons expressing the indicated combinations of IRs. Weak cilia localization of IR25a in neurons co-expressing IR25a+IR76a or IR25a+IR76b is indicated by arrowheads. Genotypes: (i) UAS-IR8a/+;OR22a-GAL4/+, (ii) UAS-IR76a/UAS-IR25a; OR22a-GAL4/+, (iii) UAS-IR25a/+;UAS-IR76b/OR22a-GAL4, (iv) UAS-IR76a/+;UAS-IR76b/OR22a-GAL4, (v) UAS-IR76a/UAS-IR25a;UAS-IR76b/OR22a-GAL4. (B) Representative traces of extracellular recordings of neuronal responses in OR22a neurons expressing the combinations of IRs shown to the left in (A) stimulated with phenylethyl amine (1% v/v). Bars above the traces mark stimulus time (1 s). Misexpression of a control receptor, IR8a, confers weak responsiveness to phenylethyl amine, which may reflect non-specific sensitization of these neurons to this odor, as IR8a does not localize to sensory cilia in the absence of IR84a (Figure 3A). (C) Concentration-responses for phenylethyl amine in OR22a neurons expressing the combinations of IRs shown in the key. Genotypes are as in (A) as well as a no IR control (“-“) (OR22a-GAL4/OR22a-GAL4) and IR25a misexpression alone (UAS-IR25a/+;OR22a-GAL4/+). Mean responses are plotted (± s.e.m; n=12–28 sensilla; ≤4 sensilla/animal, male flies). For responses to 0.1% and 1% phenylethyl amine, bars labeled with different letters are significantly different (ANOVA p<0.0001). (D) Comparison of concentration-responses for phenylethyl amine in OR22a neurons ectopically expressing IR25a+IR76a+IR76b (red) to those in endogenous ac4 sensilla (blue). Responses in OR22a neurons were corrected for background endogenous neural responses (black bars in (C)). Responses to phenylethyl amine in ac4 were measured in an IR8a1 mutant background to facilitate quantification of odor-evoked spikes in the absence of IR84a neuron activity (Figure 2B).

Similar articles

Cited by

References

    1. Ache BW, Young JM. Olfaction: diverse species, conserved principles. Neuron. 2005;48:417–430. - PubMed
    1. Ai M, Min S, Grosjean Y, Leblanc C, Bell R, Benton R, Suh GSB. Acid sensing by the Drosophila olfactory system. Nature. 2010 10.1038/nature09537. - PMC - PubMed
    1. Armstrong N, Gouaux E. Mechanisms for activation and antagonism of an AMPA-sensitive glutamate receptor: crystal structures of the GluR2 ligand binding core. Neuron. 2000;28:165–181. - PubMed
    1. Armstrong N, Sun Y, Chen GQ, Gouaux E. Structure of a glutamate-receptor ligand-binding core in complex with kainate. Nature. 1998;395:913–917. - PubMed
    1. Avidor-Reiss T, Maer AM, Koundakjian E, Polyanovsky A, Keil T, Subramaniam S, Zuker CS. Decoding cilia function: defining specialized genes required for compartmentalized cilia biogenesis. Cell. 2004;117:527–539. - PubMed

Publication types

MeSH terms

Substances