The histone deacetylase inhibitors vorinostat and romidepsin downmodulate IL-10 expression in cutaneous T-cell lymphoma cells
- PMID: 21198545
- PMCID: PMC3057296
- DOI: 10.1111/j.1476-5381.2010.01188.x
The histone deacetylase inhibitors vorinostat and romidepsin downmodulate IL-10 expression in cutaneous T-cell lymphoma cells
Abstract
Background and purpose: Vorinostat and romidepsin are histone deacetylase inhibitors (HDI), approved for the treatment of cutaneous T-cell lymphoma (CTCL). However, the mechanism(s) by which these drugs exert their anti-cancer effects are not fully understood. Since CTCL is associated with immune dysregulation, we investigated whether these HDI modulated cytokine expression in CTCL cells.
Experimental approach: CTCL cell lines and primary CTCL cells were treated in vitro with vorinostat or romidepsin, or with STAT3 pathway inhibitors. Cell cycle parameters and apoptosis were analysed by propidium iodide and annexin V/propidium iodide staining respectively. Cytokine expression was analysed using QRT-PCR and elisa assays. STAT3 expression/phosphorylation and transcriptional activity were analysed using immunoblotting and transfection/reporter assays respectively.
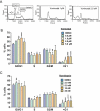
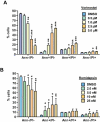
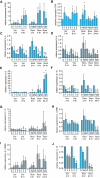
Key results: Vorinostat and romidepsin strongly down-regulated expression of the immunosuppressive cytokine, interleukin (IL)-10, frequently overexpressed in CTCL, at both the RNA and protein level in CTCL cell lines and at the RNA level in primary CTCL cells. Vorinostat and romidepsin also increased expression of IFNG RNA and decreased expression of IL-2 and IL-4 RNA, although to a lesser extent compared to IL-10. Transient exposure to vorinostat was sufficient to suppress IL-10 secretion but was not sufficient to irreversibly commit cells to undergo cell death. STAT3 pathway inhibitors decreased production of IL-10 and vorinostat/romidepsin partially decreased STAT3-dependent transcription without effects on STAT3 expression or phosphorylation.
Conclusions and implications: These results demonstrate that HDI modulate cytokine expression in CTCL cells, potentially via effects on STAT3. Immunomodulation may contribute to the clinical activity of HDI in this disease.
© 2011 The Authors. British Journal of Pharmacology © 2011 The British Pharmacological Society.
Figures


Similar articles
-
Synergy of BCL2 and histone deacetylase inhibition against leukemic cells from cutaneous T-cell lymphoma patients.Blood. 2017 Nov 9;130(19):2073-2083. doi: 10.1182/blood-2017-06-792150. Epub 2017 Oct 2. Blood. 2017. PMID: 28972015 Free PMC article.
-
Kinome profiling analysis identified Src pathway as a novel therapeutic target in combination with histone deacetylase inhibitors for cutaneous T-cell lymphoma.J Dermatol Sci. 2021 Mar;101(3):194-201. doi: 10.1016/j.jdermsci.2021.01.004. Epub 2021 Jan 22. J Dermatol Sci. 2021. PMID: 33531202
-
Romidepsin and Azacitidine Synergize in their Epigenetic Modulatory Effects to Induce Apoptosis in CTCL.Clin Cancer Res. 2016 Apr 15;22(8):2020-31. doi: 10.1158/1078-0432.CCR-15-1435. Epub 2015 Dec 9. Clin Cancer Res. 2016. PMID: 26660520
-
The safety profile of vorinostat (suberoylanilide hydroxamic acid) in hematologic malignancies: A review of clinical studies.Cancer Treat Rev. 2016 Feb;43:58-66. doi: 10.1016/j.ctrv.2015.04.003. Epub 2015 Apr 9. Cancer Treat Rev. 2016. PMID: 26827693 Review.
-
Romidepsin: a histone deacetylase inhibitor for refractory cutaneous T-cell lymphoma.Ann Pharmacother. 2012 Oct;46(10):1340-8. doi: 10.1345/aph.1R036. Epub 2012 Sep 11. Ann Pharmacother. 2012. PMID: 22968522 Review.
Cited by
-
Inhibiting Histone Deacetylases in Human Macrophages Promotes Glycolysis, IL-1β, and T Helper Cell Responses to Mycobacterium tuberculosis.Front Immunol. 2020 Jul 23;11:1609. doi: 10.3389/fimmu.2020.01609. eCollection 2020. Front Immunol. 2020. PMID: 32793237 Free PMC article.
-
NF-κB Signaling in Tumor Pathways Focusing on Breast and Ovarian Cancer.Oncol Rev. 2022 Oct 3;16:10568. doi: 10.3389/or.2022.10568. eCollection 2022. Oncol Rev. 2022. PMID: 36531159 Free PMC article. Review.
-
Small-molecule inhibitors of histone deacetylase improve CRISPR-based adenine base editing.Nucleic Acids Res. 2021 Feb 26;49(4):2390-2399. doi: 10.1093/nar/gkab052. Nucleic Acids Res. 2021. PMID: 33544854 Free PMC article.
-
Romidepsin in peripheral and cutaneous T-cell lymphoma: mechanistic implications from clinical and correlative data.Br J Haematol. 2015 Jul;170(1):96-109. doi: 10.1111/bjh.13400. Epub 2015 Apr 19. Br J Haematol. 2015. PMID: 25891346 Free PMC article. Clinical Trial.
-
Understanding Cancer's Defense against Topoisomerase-Active Drugs: A Comprehensive Review.Cancers (Basel). 2024 Feb 6;16(4):680. doi: 10.3390/cancers16040680. Cancers (Basel). 2024. PMID: 38398072 Free PMC article. Review.
References
-
- Ansel KM, Djuretic I, Tanasa B, Rao A. Regulation of Th2 differentiation and IL-4 locus accessibility. Annu Rev Immunol. 2006;24:607–656. - PubMed
-
- Asadullah K, Docke WD, Haeussler A, Sterry W, Volk HD. Progression of mycosis fungoides is associated with increasing cutaneous expression of interleukin-10 mRNA. J Invest Dermatol. 1996;107:833–837. - PubMed
-
- Berger CL, Hanlon D, Kanada D, Dhodapkar M, Lombillo V, Wang N, et al. The growth of cutaneous T-cell lymphoma is stimulated by immature dendritic cells. Blood. 2002;99:2929–2939. - PubMed
-
- Berger CL, Tigelaar R, Cohen J, Mariwalla K, Trinh J, Wang N, et al. Cutaneous T-cell lymphoma: malignant proliferation of T-regulatory cells. Blood. 2005;105:1640–1647. - PubMed
-
- Blaskovich MA, Sun J, Cantor A, Turkson J, Jove R, Sebti SM. Discovery of JSI-124 (cucurbitacin I), a selective Janus kinase/signal transducer and activator of transcription 3 signaling pathway inhibitor with potent antitumor activity against human and murine cancer cells in mice. Cancer Res. 2003;63:1270–1279. - PubMed
Publication types
MeSH terms
Substances
Grants and funding
LinkOut - more resources
Full Text Sources
Miscellaneous

