. 2011 Mar;85(6):2837-50.
doi: 10.1128/JVI.02175-10. Epub 2010 Dec 29.

Initiation of Epstein-Barr virus lytic replication requires transcription and the formation of a stable RNA-DNA hybrid molecule at OriLyt

Affiliations

Initiation of Epstein-Barr virus lytic replication requires transcription and the formation of a stable RNA-DNA hybrid molecule at OriLyt

Andrew J Rennekamp et al. J Virol. 2011 Mar.

Abstract

The genetic elements of herpesvirus origins of lytic replication have been characterized in detail; however, much remains to be elucidated concerning their functional role in replication initiation. In the case of the Epstein-Barr virus (EBV), we have found that in addition to the two well-defined critical elements required for lytic replication (the upstream and downstream essential elements, UEE and DEE), the origin of lytic replication (OriLyt) also requires the presence of a GC-rich RNA in cis. The BHLF1 transcript is similar to the essential K5 transcript identified at the Kaposi's sarcoma-associated herpesvirus OriLyt. We have found that truncation of the BHLF1 transcript or deletion of the TATA box, but not the putative ATG initiation codon, reduce OriLyt function to background levels. By using an antibody specific for RNA-DNA hybrid molecules, we found the BHLF1 RNA stably annealed to its DNA template during the early steps of lytic reactivation. Furthermore, expression of human RNase H1, which degrades RNA in RNA-DNA hybrids, drastically reduces OriLyt-dependent DNA replication as well as recruitment of the viral single-stranded DNA binding protein BALF2 to OriLyt. These studies suggest that a GC-rich OriLyt transcript is an important component of gammaherpesvirus lytic origins and is required for initial strand separation and loading of core replication proteins.


Figures
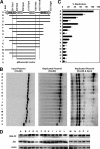
FIG. 1.
FIG. 1.
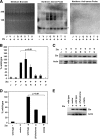
The BHLF1 or BHRF1 transcript regions are required for OriLyt function. Sequences of various lengths were amplified from the BamHI H fragment of Epstein-Barr virus, cloned into a pBluescript plasmid vector, and tested for the ability to support lytic replication. (A) Diagram of the full-length (2,372-bp) region of OriLytL and each of the various truncations experimentally tested. (B) pBluescript-OriLyt or vector control plasmids were transected into ZKO-293 cells along with the BZLF1 gene. Plasmids were analyzed by Southern blotting before (left panel) or after (center and right panels) transfection and lytic induction. Plasmids recovered from cells were digested with or without DpnI enzyme (as indicated). One representative experiment is shown. (C) Relative plasmid amounts were quantified using quantitative Southern blotting. Results were calculated as the DpnI-digested signal divided by the input plasmid signal and normalized to the value obtained for full-length (2,372-bp) OriLyt. Data averages from three identical, independent experiments are shown, with error bars representing the standard deviations. (D) Western blotting was used to monitor Zta and BALF2 protein expression levels in all transfected cells.
FIG. 2.
FIG. 2.
BHLF1 RNA is required for OriLyt function in cis. (A) Insertional mutations were made to disrupt several regions of the OriLyt sequence cloned into the pBluescript vector. These mutant plasmids were then tested for their ability to support lytic replication. (B) Wild-type or mutant pBluescript-OriLyt or vector control plasmids were transected into ZKO-293 cells along with the BZLF1 gene. Plasmids were analyzed by Southern blotting before (top panel) or after (center and bottom panels) transfection and lytic induction. Plasmids recovered from cells were digested with or without DpnI enzyme (as indicated). One representative experiment is shown. (C) Relative plasmid amounts were quantified using quantitative Southern blotting. Results were calculated as the DpnI-digested signal divided by the input plasmid signal and normalized to the value obtained for wild-type OriLyt. Data averages from three independent experiments are shown, with error bars representing the standard deviations. Statistical significance was determined using a two-tailed, unpaired t test. (D) Western blot assays were used to monitor Zta and BALF2 protein expression levels in all transfected cells.
FIG. 3.
FIG. 3.
Effects of OriLyt mutations on BHLF1 transcription. (A to C) Wild-type or mutant pBluescript-OriLyt plasmids were transected into 293 cells along with the BZLF1 gene. (A) RNA was isolated and fractionated by agarose gel electrophoresis in the presence of ethidium bromide (left panel) and analyzed by Northern blotting with BHLF1 sense (center panel) or antisense (right panel) probes. One representative experiment is shown. A nonspecific band is indicated by the asterisk. (B) Relative RNA amounts were quantified using quantitative Northern blot analysis. Results were normalized to the value obtained for wild-type OriLyt. Data averages from three identical, independent experiments are shown, with error bars representing the standard deviations. Statistical significance was calculated using a one-tailed, paired t test. (C) Western blot assays were used to monitor Zta and BALF2 protein expression levels in all transfected cells. (D and E) Identical mutations were generated in the promoter of the pHEBO-BHLF1p-luciferase plasmid. These plasmids were cotransfected with the BZLF1 gene into 293 cells and assayed for the ability to express firefly luciferase. (D) Results were first normalized to an internal Renilla luciferase control and then to the wild-type signal. Data averages from three identical, independent experiments are shown, with error bars representing the standard deviations. Statistical significance was calculated using a two-tailed, unpaired t test. (E) Western blot assays were used to monitor Zta protein expression levels in all transfected cells.
FIG. 4.
FIG. 4.
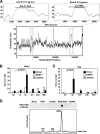
An RNA-DNA hybrid is formed at the G-rich BHLF1 region during initiation of lytic replication. (A) The guanine density of the entire EBV genome was plotted using the EMBOSS Freak program (lower plot). The BamHI H and BamHI d fragments, containing the BHLF1 and LF3 genes, respectively (gray boxes), have been enlarged (upper panels). (B and C) Mutu I (B) or Raji (C) cells were treated with or without Na-butyrate and TPA for times (in hours) indicated. DNA was then isolated and analyzed via immunoprecipitation using an antibody specific for RNA-DNA hybrid molecules or an IgG negative control, followed by real-time qPCR using primers for the OriLyt region (black boxes), the BNRF1 transcript region of the virus (white boxes), or the cellular region for GAPDH (gray boxes) as a negative control. Results are shown as the fold enrichment of the RNA-DNA signal over that of the IgG control. Error bars represent the standard deviations of at least three qPCR replicate reactions run side by side. Three identical, independent experiments were conducted; data from one representative experiment are shown. Statistical significance was calculated using a two-tailed, unpaired t test. (D) Nucleotides of various types (as indicated) were annealed, spotted onto a nylon membrane, and probed using the RNA-DNA hybrid antibody to demonstrate antibody specificity (top panel). Pixel density across a horizontal section of the top panel image was calculated using the ImageJ software (NIH). Numerical values indicate integrated densities for each peak.
FIG. 5.
FIG. 5.
Insertion of a non-G-rich transcript disrupts OriLyt function. (A) Wild-type or mutant pBluescript-OriLyt or vector control plasmids were transected into ZKO-293 cells with or without the BZLF1 gene. Plasmids were analyzed by Southern blotting before (data not shown) or after (as indicated) transfection and lytic induction. Plasmids recovered from cells were digested with or without DpnI enzyme (as indicated). One representative experiment is shown. (B) Relative plasmid amounts were quantified using quantitative Southern blotting. Results were calculated as the DpnI-digested signal divided by the input plasmid signal and normalized to the value obtained for wild-type OriLyt. Data averages from three independent experiments are shown, with error bars representing the standard deviations. Statistical significance was determined using a two-tailed, unpaired t test.
FIG. 6.
FIG. 6.
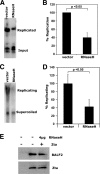
RNase H1 impairs OriLyt-dependent plasmid replication. Wild-type pBluescript OriLyt plasmids were cotransfected with BZLF1 into ZKO-293 cells with an RNase H1 expression plasmid or control vector. Plasmids were recovered from cells, digested with (A and B) or without (C and D) HindIII and DpnI enzymes, and analyzed by Southern blotting. Three identical, independent experiments were conducted in each case. One representative experiment is shown for each (A and C). Relative plasmid amounts were quantified using quantitative Southern blotting (B and D). In the cases where enzymes were used, results were calculated as the DpnI-resistant signal over the DpnI-digested signal and were normalized to the value obtained for vector controls (B). In cases where no enzymes were used, results were calculated as replicating (top band) plasmid over supercoiled (bottom band) signal and normalized to the value obtained for vector controls (D). Data averages from all three identical, independent experiments are shown in each case, with error bars representing the standard deviations. Statistical significance was calculated using a two-tailed, unpaired t test. (E) Western blot assays were used to monitor Zta and BALF2 protein expression levels in all transfected cells.
FIG. 7.
FIG. 7.
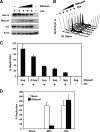
RNase H1 impairs EBV lytic replication. ZKO-293 cells were cotransfected with or without BZLF1 and RNase H1 expression plasmids or control vectors as shown. (A) Western blot assays were used to monitor Zta, RNase H1, and BALF2 protein expression levels in all transfected cells. (B) After 48 h, cells were analyzed for potential changes in viability and cell cycle. (C) At the same time, viral DNA was isolated and analyzed by real-time qPCR. Results were calculated as the signal obtained using EBV genome-specific (BNRF1) primers over the signal obtained using primers for cellular DNA (GAPDH) and normalized to the positive control expressing BZLF1 only. (D) 293 cells were transfected with RNase H1 (black bars) or vector control plasmids (white bars) and infected with HSV1 (as indicated) or mock infected 24 h posttransfection. At 10 h postinfection, cell were lysed and RNase H1 expression was confirmed by Western blotting (data not shown). DNA was isolated from cell lysates and analyzed by real-time qPCR. Results were calculated as the signal obtained using viral genome-specific (TKp) primers over the signal obtained using primers for cellular DNA (GAPDH) and normalized to the positive-control sample, which was infected with virus but not transfected with RNase H1.
FIG. 8.
FIG. 8.
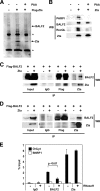
RNase H1 decreases recruitment of BALF2, but not Zta, to OriLyt. (A and B) ZKO-293 cells were transfected with FLAG-Zta or control FLAG expression vector and then subjected to FLAG IP. FLAG affinity-purified proteins were assayed by colloidal blue staining of the affinity-purified proteins (A) or by Western blotting (WB) for the viral BALF2 and Zta or the cellular, PARP1, and RecQL1 proteins (B). The immunoglobulin heavy and light chains are each marked by an asterisk. (C and D) ZKO-293 (C) or 293 (D) cells were transfected with FLAG-BALF2 and Zta or control vector and then subjected to FLAG, Zta, or control IgG IP. Affinity-purified proteins were probed for BALF2 or Zta by WB. (E) A ChIP assay was used to monitor BALF2 and Zta binding to OriLyt (black bars) or the BNRF1 negative-control region (white bars) in vivo in ZKO-293 cells transfected with FLAG-BALF2 and Zta in the presence of cotransfected RNase H1 (+) or vector control (−). Results from real-time qPCR were normalized to input DNA signal levels. Error bars represent the standard deviations of at least six qPCR replicate reactions run side by side. Three identical, independent experiments were conducted; data from one representative experiment are shown. Statistical significance was calculated using a two-tailed, unpaired t test.

Similar articles

Cited by

References

    1. Baumann, M., R. Feederle, E. Kremmer, and W. Hammerschmidt. 1999. Cellular transcription factors recruit viral replication proteins to activate the Epstein-Barr virus origin of lytic DNA replication, oriLyt. EMBO J. 18:6095-6105. - PMC - PubMed
    1. Billaud, G., D. Thouvenot, and F. Morfin. 2009. Drug targets in herpes simplex and Epstein Barr virus infections. Infect. Disord. Drug Targets 9:117-125. - PubMed
    1. Binne, U. K., W. Amon, and P. J. Farrell. 2002. Promoter sequences required for reactivation of Epstein-Barr virus from latency. J. Virol. 76:10282-10289. - PMC - PubMed
    1. Boehmer, P. E. 2004. RNA binding and R-loop formation by the herpes simplex virus type-1 single-stranded DNA-binding protein (ICP8). Nucleic Acids Res. 32:4576-4584. - PMC - PubMed
    1. Boguslawski, S. J., et al. 1986. Characterization of monoclonal antibody to DNA.RNA and its application to immunodetection of hybrids. J. Immunol. Methods 89:123-130. - PubMed

Publication types