. 2010 Dec 10;5(12):e15360.
doi: 10.1371/journal.pone.0015360.

Acetaminophen induces apoptosis in rat cortical neurons

Affiliations

Acetaminophen induces apoptosis in rat cortical neurons

Inmaculada Posadas et al. PLoS One. .

Abstract

Background: Acetaminophen (AAP) is widely prescribed for treatment of mild pain and fever in western countries. It is generally considered a safe drug and the most frequently reported adverse effect associated with acetaminophen is hepatotoxicity, which generally occurs after acute overdose. During AAP overdose, encephalopathy might develop and contribute to morbidity and mortality. Our hypothesis is that AAP causes direct neuronal toxicity contributing to the general AAP toxicity syndrome.

Methodology/principal findings: We report that AAP causes direct toxicity on rat cortical neurons both in vitro and in vivo as measured by LDH release. We have found that AAP causes concentration-dependent neuronal death in vitro at concentrations (1 and 2 mM) that are reached in human plasma during AAP overdose, and that are also reached in the cerebrospinal fluid of rats for 3 hours following i.p injection of AAP doses (250 and 500 mg/kg) that are below those required to induce acute hepatic failure in rats. AAP also increases both neuronal cytochrome P450 isoform CYP2E1 enzymatic activity and protein levels as determined by Western blot, leading to neuronal death through mitochondrial-mediated mechanisms that involve cytochrome c release and caspase 3 activation. In addition, in vivo experiments show that i.p. AAP (250 and 500 mg/kg) injection induces neuronal death in the rat cortex as measured by TUNEL, validating the in vitro data.

Conclusions/significance: The data presented here establish, for the first time, a direct neurotoxic action by AAP both in vivo and in vitro in rats at doses below those required to produce hepatotoxicity and suggest that this neurotoxicity might be involved in the general toxic syndrome observed during patient APP overdose and, possibly, also when AAP doses in the upper dosing schedule are used, especially if other risk factors (moderate drinking, fasting, nutritional impairment) are present.


Conflict of interest statement

Competing Interests: The authors have declared that no competing interests exist.

Figures

Figure 1
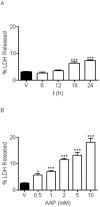
Figure 1. AAP reduces rat cortical neuron viability.
(A) Time course effect of AAP treatment (1 mM) on cellular viability expressed as percentage of LDH released to culture medium. V stands for vehicle (DMSO 1‰)-treated cells. Data represent mean ± SEM of 12 experiments. ***p<0.01, as compared to vehicle-treated cells. (B) Concentration-response effect of AAP on rat cortical neuron viability 24 h after treatment. V stands for vehicle (DMSO 1‰)-treated cells. Data represent mean ± SEM of 12 experiments. *p<0.05 and ***p<0.01, as compared to vehicle-treated cells.
Figure 2
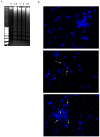
Figure 2. AAP induces apoptotic death in rat cortical neurons.
(A) DNA degradation laddering pattern observed in rat cortical neurons after treatment with AAP 0.5, 1 and 2 mM or staurosporine (St), used as a positive control, for 24 h. Vehicle-treated cells (DMSO 1‰; V) did not show DNA degradation. (B) Hoechst 33342 staining of cortical neuron nuclei treated with vehicle (DMSO 1‰; upper panel), AAP 0.5 mM (middle panel) or AAP 1 mM (lower panel) for 24 h. Arrows show fragmented chromatin. Images are representative of one experiment repeated 3 times with similar results.
Figure 3
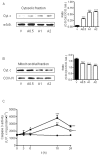
Figure 3. Lost of neuronal cells induced by AAP is mediated by activation of intrinsic apoptotic pathway.
(A) Left. Cytochrome c (Cyt c) release from mitochondria to cytosol 24 h after AAP-treatment. Cells were treated with vehicle (DMSO 1‰; V) or AAP at 0.5 (A0.5), 1(A1) or 2 (A2) mM for 24 h and the cytosolic fraction was obtained. α-Tubulin (α-tub) was used as cytosolic protein loading control. Right. Densitometric analysis of Cyt c related to α-tubulin (α-tub.) protein levels detected in cytosolic fraction. Data are expressed as mean ± SEM of 3 independent experiments. ***p<0.001 as compared to vehicle-treated cells. (B) Left. Same experiment as in (A), but Cyt c mitochondrial content was determined. COX-IV was used as mitochondrial protein loading control. Right. Densitometric analysis of Cyt c related to COX-IV protein levels detected in mitochondrial fraction. Data are expressed as mean ± SEM of 3 experiments. ***p<0.001 compared to vehicle-treated cells. (C) Time-course of caspase 3 activaty induced by AAP. Cortical neurons were incubated with vehicle (DMSO 1‰; •), AAP 1 mM (□) or AAP 2 mM (▪). After different time periods, cell lysates were obtained and caspase 3 activity determined as indicated in Material and Methods. Data represent mean ± SEM of 12 independent experiments. *p<0.05; **p<0.01; *** p<0.001 as compared to vehicle-treated cells. When not shown, SE bars were smaller than the symbol size.
Figure 4
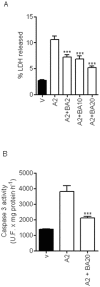
Figure 4. Bongkrekic acid (BA) prevents AAP-induced neuronal death.
(A) BA, by inhibiting mitochondrial permeability transition, markedly reduced AAP-mediated toxicity on rat cortical neurons in a concentration-dependent manner. Cells were treated with vehicle (DMSO 1‰; V) or AAP 2 mM (A2) in the presence or absence of BA at different concentrations for 24 h and the percentage of LDH released to culture medium was quantified. Data represent mean ± SEM of 9 independent experiments. *** p<0.001 as compared to A2-treated cells. (B) BA prevents caspase 3 activation induced by AAP. Cells were treated with vehicle (DMSO 1‰; V) or AAP 2 mM (A2) in the presence or absence of BA 20 µM (A2+ BA20) for 18 h and caspase 3 activity in total lysates was determined. Data represent mean ± SEM of 12 independent experiments. *** p<0.001 as compared to A2-treated cells.
Figure 5
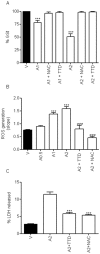
Figure 5. Redox status of rat cortical neurons.
(A) Neuronal glutathione levels were decreased by treatment with 1 mM (A1) or 2 mM (A2) AAP in a concentration-dependent manner whereas co-treatment with either N-acetylcysteine (NAC; 100 µM) or disulfiram (TTD; 0.1 µM) completely restored glutathione content to basal levels. V stands for vehicle (DMSO 1‰)-treated cells. Data represent mean ± SEM of 9 independent experiments. *** p<0.001 as compared to vehicle-treated cells). (B) AAP 0.5 (A0.5), 1 (A1) and 2 mM (A2) induced a dose-dependent increase in the rate of reactive oxygen species (ROS) production, that was prevented by both N-acetylcysteine (NAC; 100 µM) and disulfiram (TTD, 0.1 µM). V stands for vehicle (DMSO 1‰)-treated cells. Data represent the mean ± SEM of 9 independent experiments. ***, p<0.001 as compared to vehicle-treated cells (V); ###, p<0.001 compared to AAP 2 mM (A2). (C) NAC (100 µM) as well as TTD (0.1 µM), by reducing free radical production, markedly reduce AAP-mediated toxicity on rat cortical neurons. Cortical neurons were incubated with vehicle (DMSO 1‰; V) or AAP 2 mM (A2) alone or in the presence of NAC 100 µM (A2+NAC) or TTD 0.1 µM (A2+TTD) for 24 h and percentage of LDH released to the culture medium was determined. Data represent the mean ± SEM of 9 independent experiments. ***, p<0.001 as compared to AAP 2 mM-treated cells.
Figure 6
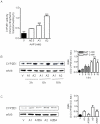
Figure 6. Free radicals generated from AAP metabolism, through CYP2E1 activity, play a central role in AAP-induced neuronal death, in a mechanism dependent on mitochondrial permeability transition.
(A) AAP increases CYP2E1 activity in a concentration-dependent manner in rat cortical neurons. Cells were treated with vehicle (DMSO 1‰; V) or AAP 0.5 (A0.5), 1 (A1) and 2 mM (A2)) for 18 h and total lysates were obtained. CYP2E1 activity was quantified as nmol p-nitrophenol transformed per milligram of protein in total lysates. Data represent the mean ± SEM of 9 independent experiments. *** p<0.001 as compared to vehicle-treated cells (V). (B) AAP increases CYP2E1 protein levels in a time- and concentration-dependent manner. Left. CYP2E1 expression detected in total lysates obtained from cells treated with vehicle (DMSO 1‰; V) or AAP at 1 mM (A1) or 2 mM (A2) for 3, 6 and 18 h. α-Tubulin (α-tub) was used as protein loading control. Right. Densitometric analysis of CYP2E1 related to α-tubulin (α-tub.) protein levels detected in total lysates. Data are expressed as mean ± SEM of 3 independent experiments. *p<0.05; **p<0.01; ***p<0.001 compared to vehicle-treated cells. (C) Bongkrekic (BA), by inhibiting mitochondrial permeability transition, prevents AAP-induced CYP2E1 induction. Left. CYP2E1 expression detected in total lysates obtained from cells treated with vehicle (DMSO 1‰; V) or AAP 1 mM () and 2 mM in the absence (A1; A2) and the presence of BA 20 µM (A1BA; A2BA) for 18 h. α-Tubulin (α-tub.) was used as protein loading control. Right. Densitometric analysis of CYP2E1 related to α-tubulin (α-tub.) protein levels detected in total lysates. Data are expressed as mean ± SEM of 3 independent experiments. *p<0.05 as compared to A1-treated cells; ##, p<0.01 as compared to A2-treated cells.
Figure 7
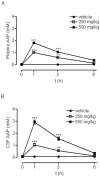
Figure 7. Time-course of rat plasma and cerebrospinal fluid (CSF) AAP levels.
(A) Time-course of AAP plasma levels measured after intraperitoneal administration of vehicle (H2O:PEG, 1∶1; •), AAP 250 mg/kg (□) and 500 mg/kg (▪). Data represent mean ± SEM of 6 animals. **p<0.01; ***p<0.001 as compared to vehicle-treated cells. (B) Time-course of AAP CSF levels measured after intraperitoneal administration of vehicle (H2O:PEG, 1∶1; •), AAP 250 mg/kg (□) and 500 mg/kg (▪). Data represent mean ± SEM of 6 animals. **, p<0.01; *** p<0.001 as compared to vehicle treated cells.
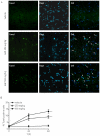
Figure 8
Figure 8. Acetaminophen toxicity in vivo. A.
Brain cortex tissue slices (5 µM thick) from vehicle (V; H2O:PEG, 1∶1), AAP (250 mg/Kg i.p.) and AAP (500 mg/Kg i.p) injected animals obtained 24 h post-injection, were double-stained with Dapi to identify nuclei, apoptotic neurons were labelled using TUNEL as indicated in Material and Methods. An overlay of both signals (Ovl) is also presented. Arrows indicate cells showing an overlay of TUNEL and Dapi signals. The figure shows a representative experiment that was repeated 3 times with similar results. B. Quantification of damaged neurons. Data represent the percentage of TUNEL positive cells related to total Dapi stained cells. For quantification, a total of 12 image fields from 2 different animals were used for each condition. The average number of cells per field was 79.1±2.8 (mean ± SEM). For each field, the percentage of TUNEL positive neurons was determined. The total number of neurons (100% of the y axis) counted for each experimental condition was: 990 for vehicle; 1050 for AAP (250 mg/Kg)-treated rats and 920 for AAP (500 mg/kg)-treated rats. Data represent mean ± SEM of the percentage of TUNEL positive cells in 12 image fields from 2 different animals for each condition. ***p<0.001 as compared to vehicle treated animals.
Figure 9
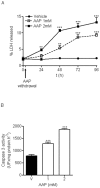
Figure 9. Toxicity of transient exposure to AAP.
A. Cortical neurons were incubated with vehicle (H2O:PEG, 1∶1; •), AAP 1 mM (□) and AAP 2 mM (▪) and 3 h later, the medium containing the drug was removed (AAP withdrawal) and replaced with medium lacking the drug, mimicking what happens in vivo. The percentage of LDH released was measured to study cumulative toxicity at different times. Data represent mean ± SEM of 9 independent experiments. **p<0.01; *** p<0.001 as compared to vehicle treated cells. B. Same protocol as in A, but caspase 3 activity was determined at 18 h after treatment. Data represent mean ± SEM of 9 independent experiments. ***p<0.001 as compared to vehicle-treated cells (v).

Similar articles

Cited by

References

    1. Botting RM. Mechanism of action of acetaminophen: is there a cyclooxygenase 3. Clin Infect Dis. 2000;31(Suppl 5):S202–S210. - PubMed
    1. Headley J, Northstone K. Medication administered to children from 0 to 7.5 years in the Avon Longitudinal Study of Parents and Children (ALSPAC). Eur J Clin Pharmacol. 2007;63:189–195. - PMC - PubMed
    1. Wilcox CM, Cryer B, Triadafilopoulos G. Patterns of use and public perception of over-the-counter pain relievers: focus on nonsteroidal antiinflammatory drugs. J Rheumatol. 2005;32:2218–2224. - PubMed
    1. Kurtovic J, Riordan SM. Paracetamol-induced hepatotoxicity at recommended dosage. J Intern Med. 2003;253:240–243. - PubMed
    1. Bolesta S, Haber SL. Hepatotoxicity associated with chronic acetaminophen administration in patients without risk factors. Ann Pharmacother. 2002;36:331–333. - PubMed

Publication types