. 2011 Mar 4;286(9):7359-69.
doi: 10.1074/jbc.M110.204941. Epub 2010 Dec 17.

Arrestin-rhodopsin binding stoichiometry in isolated rod outer segment membranes depends on the percentage of activated receptors

Affiliations

Arrestin-rhodopsin binding stoichiometry in isolated rod outer segment membranes depends on the percentage of activated receptors

Martha E Sommer et al. J Biol Chem. .

Abstract

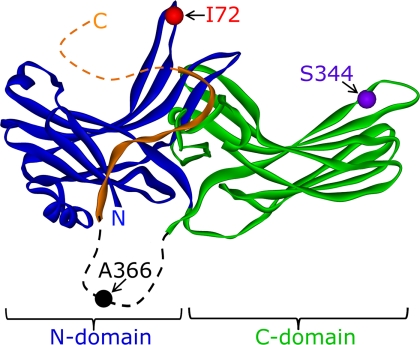
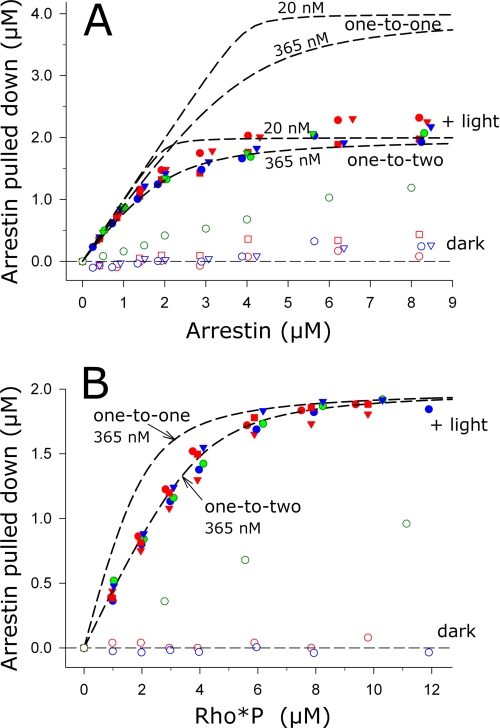
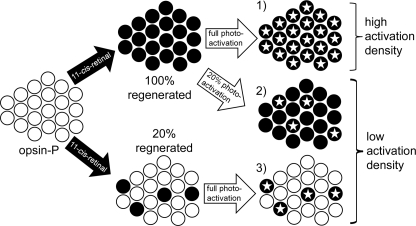
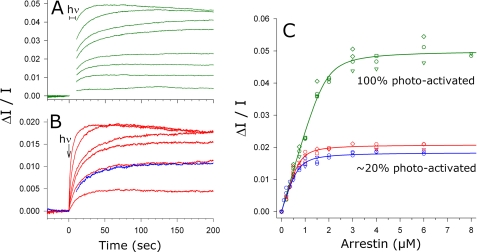
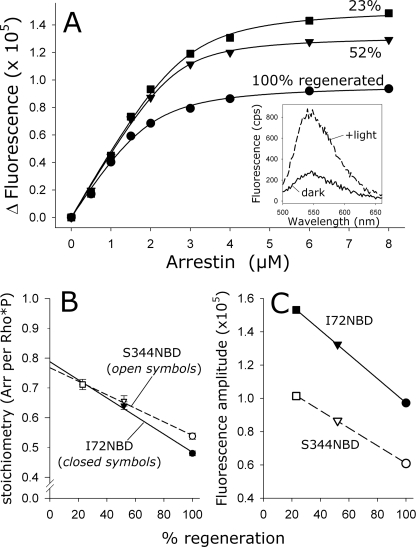
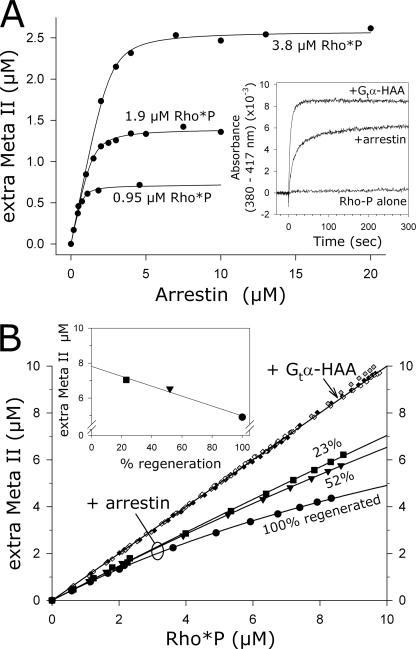
In the rod cell of the retina, arrestin is responsible for blocking signaling of the G-protein-coupled receptor rhodopsin. The general visual signal transduction model implies that arrestin must be able to interact with a single light-activated, phosphorylated rhodopsin molecule (Rho*P), as would be generated at physiologically relevant low light levels. However, the elongated bi-lobed structure of arrestin suggests that it might be able to accommodate two rhodopsin molecules. In this study, we directly addressed the question of binding stoichiometry by quantifying arrestin binding to Rho*P in isolated rod outer segment membranes. We manipulated the "photoactivation density," i.e. the percentage of active receptors in the membrane, with the use of a light flash or by partially regenerating membranes containing phosphorylated opsin with 11-cis-retinal. Curiously, we found that the apparent arrestin-Rho*P binding stoichiometry was linearly dependent on the photoactivation density, with one-to-one binding at low photoactivation density and one-to-two binding at high photoactivation density. We also observed that, irrespective of the photoactivation density, a single arrestin molecule was able to stabilize the active metarhodopsin II conformation of only a single Rho*P. We hypothesize that, although arrestin requires at least a single Rho*P to bind the membrane, a single arrestin can actually interact with a pair of receptors. The ability of arrestin to interact with heterogeneous receptor pairs composed of two different photo-intermediate states would be well suited to the rod cell, which functions at low light intensity but is routinely exposed to several orders of magnitude more light.


Figures

FIGURE 1.
FIGURE 1.
Locations of fluorophore attachment. Model of arrestin derived from the crystal structure (12). The N-domain is colored blue; the C-domain is colored green, and the C-terminal tail is colored orange. The residues, which were individually mutated to cysteine and then reacted with the IANBD fluorophore, are indicated. Note that Ala-366 is located in a long flexible loop (dashed) not visible in the crystal structure. The receptor-binding interface of arrestin is oriented toward the top in this figure.
FIGURE 2.
FIGURE 2.
Apparent arrestin-Rho*P binding stoichiometry was one-to-two at high photoactivation density. A, arrestin was titrated against 4 μm Rho*P. B, Rho*P was titrated against 2 μm arrestin. For each titration, binding of arrestin was measured by the centrifugal pulldown assay in the dark (open symbols) and after full photoactivation (closed symbols) using fluorescently labeled arrestin mutants (A366NBD, red; S344NBD, blue; I72NBD, green). Data points from independent experiments are indicated by differently shaped symbols. Note that the high amount of dark binding for arrestin I72NBD was due to the special experimental conditions used for this mutant (see text for details). The dashed traces represent binding curves corresponding to stoichiometries of one arrestin to one Rho*P (one-to-one) or one arrestin to two Rho*P (one-to-two). For the arrestin titration in A, we have included binding curves corresponding to the published KD of 20 nm (23) and our experimentally determined value of 365 nm (Table 1). For the Rho*P titration in B, we have included curves calculated using a KD of 365 nm. Both the arrestin and Rho*P titrations are consistent with a one-to-two stoichiometry.
FIGURE 3.
FIGURE 3.
Schematic showing how different photoactivation densities were achieved using either partial regeneration or light flash. Starting from left- hand side, isolated and washed ROS membranes containing phosphorylated opsin (white circles) can either be fully (top) or partially (bottom) regenerated with 11-cis-retinal to reform dark state RhoP (black circles). 1) Full photoactivation of fully regenerated ROS membranes leads to high active receptor density. Activated receptors (Rho*P) are represented by an inscribed star. 2) Exposing full-regenerated membranes to a calibrated light flash leads to low active receptor density. 3) Same photoactivation density as described in 2 can be achieved by full photoactivation of partially regenerated membranes.
FIGURE 4.
FIGURE 4.
Apparent arrestin-Rho*P binding stoichiometry was different at high and low photoactivation densities. A, light scattering signals (green traces) were measured for an arrestin titration against 4 μm Rho*P. The samples were fully photoactivated at t = 0 s. The binding signal between 0 and 10 s was obscured by the photoactivating light and has been removed for clarity. From the bottom to top, LS signals correspond to 0.2, 0.5, 0.75, 1, 1.5, 2, 4, and 8 μm arrestin A366NBD. B, as in A, except that ROS-P membranes containing 4 μm RhoP were exposed to a flash, which photoactivated 23% of the RhoP (0.92 μm Rho*P, red traces). From the bottom to top, LS signals correspond to 0.2, 0.5, 0.75, 1, 2, and 6 μm arrestin A366NBD. Similar binding kinetics were observed for arrestin (0.5 μm) binding to 25% regenerated ROS-P membranes after full photoactivation (1 μm Rho*P, blue trace). Note that the y scales are different for A and B. C, maximum LS amplitudes were plotted as a function of arrestin concentration for 100% photoactivated membranes (green symbols), 23% photoactivated membranes (red symbols), and 25% regenerated, fully photoactivated membranes (blue symbols). Independent experiments are represented as differently shaped symbols, and the color scheme of the titration plots matches the raw data shown in A and B. The fitted curves report that the arrestin-Rho*P binding ratio was one-to-two at high photoactivation density and closer to one-to-one at ∼20% photoactivation density. , light; A366NBD, IANBD-labeled arrestin mutant A366C.
FIGURE 5.
FIGURE 5.
Apparent arrestin-Rho*P binding stoichiometry was linearly related to the photoactivation density. A, arrestin I72NBD was titrated against 4 μm Rho*P at different photoactivation densities, which were achieved by using ROS-P membranes that were regenerated to different levels (100%, circles; 52%, triangles; and 23%, squares). Note that for each binding curve, the amount of activated receptor was the same (4 μm), although the amount of total opsP varied depending on the regeneration level. Inset, fluorescence was measured in the dark (solid trace) and after full photoactivation (dashed trace). The Δ Fluorescence represents the difference between the buffer-subtracted integrated fluorescence intensities of the dark and +light spectra. Fluorescence data were fit to binding curves (see Table 1). B, relationship between the photoactivation density and the stoichiometry, which was determined from the fitted binding curves. Data points represent the average of two independent experiments. Note that both fluorescently labeled arrestin mutants I72NBD (closed symbols) and S344NBD (open symbols) report nearly the same stoichiometry at each photoactivation density and the same linear dependence of stoichiometry on photoactivation density. C, relationship between the photoactivation density and the maximum fluorescence amplitude, which is directly related to the total amount of arrestin binding. Both I72NBD and S344NBD report the same linear dependence.
FIGURE 6.
FIGURE 6.
Each arrestin molecule stabilized one receptor molecule as Meta II. A, unlabeled arrestin was titrated against three different concentrations of RhoP (5, 10, or 20 μm), and the amount of stabilized Meta II following an activating flash (19%) was measured as shown in the inset. The concentrations of Rho*P in each titration are indicated. The fitted curves reported that 0.7 arrestins bound for every light-activated rhodopsin (Rho*P). Likewise, ∼70% of Rho*P was stabilized as Meta II. Inset, binding to and stabilization of Meta II over its precursor Meta I resulted in an increase in absorbance (380–417 nm). Meta II stabilization by arrestin was quantified by comparing absorption signals to those obtained with the peptide Gtα-HAA, which stabilized all Rho*P as Meta II. Samples contained 10 μm RhoP plus 300 μm Gtα-HAA or 10 μm arrestin and were activated by a flash at t = 0 s. B, fully or partially regenerated ROS membranes containing 10 μm RhoP were sequentially photoactivated. In the presence of Gtα-HAA (300 μm), every Rho*P was stabilized as Meta II (closed diamonds, 100% regenerated ROS-P; gray diamonds, 52% regenerated ROS-P; open diamonds, 23% regenerated ROS-P). In the presence of arrestin (20 μm), different proportions of Rho*P were stabilized as Meta II, depending on the photoactivation density (circles, 100% regenerated ROS-P; triangles, 52% regenerated ROS-P; squares, 23% regenerated ROS-P). An extrapolation of the data points to full photoactivation indicated a linear relationship between the amount of stabilized Meta II and the photoactivation density (inset).

Similar articles

Cited by

References

    1. Gurevich V. V., Gurevich E. V. (2008) Trends Neurosci. 31, 74–81 - PMC - PubMed
    1. Kobilka B. K. (2007) Biochim. Biophys. Acta 1768, 794–807 - PMC - PubMed
    1. Hofmann K. P., Scheerer P., Hildebrand P. W., Choe H. W., Park J. H., Heck M., Ernst O. P. (2009) Trends Biochem. Sci. 34, 540–552 - PubMed
    1. Gurevich E. V., Gurevich V. V. (2006) Genome Biol. 7, 236. - PMC - PubMed
    1. Palczewski K., Kumasaka T., Hori T., Behnke C. A., Motoshima H., Fox B. A., Le Trong I., Teller D. C., Okada T., Stenkamp R. E., Yamamoto M., Miyano M. (2000) Science 289, 739–745 - PubMed

Publication types

LinkOut - more resources