. 2011 Mar 4;286(9):7468-78.
doi: 10.1074/jbc.M110.179242. Epub 2010 Dec 15.

FoxO transcription factors promote cardiomyocyte survival upon induction of oxidative stress

Affiliations

FoxO transcription factors promote cardiomyocyte survival upon induction of oxidative stress

Arunima Sengupta et al. J Biol Chem. .

Abstract

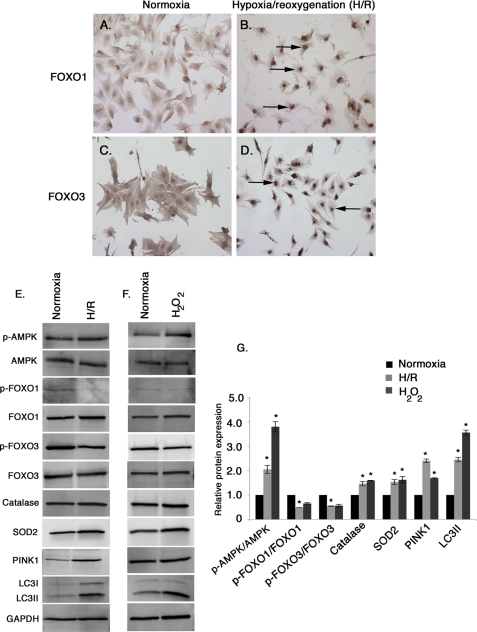
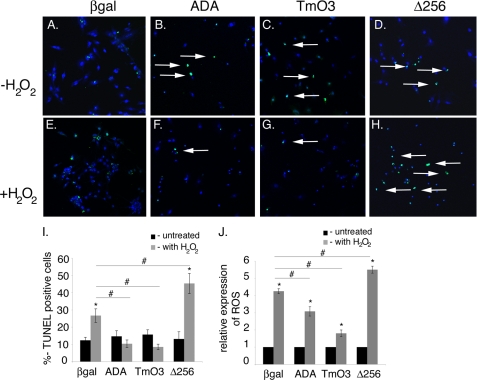
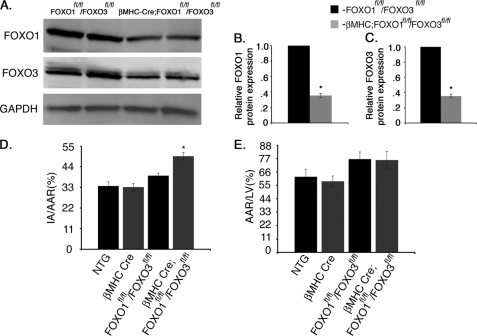
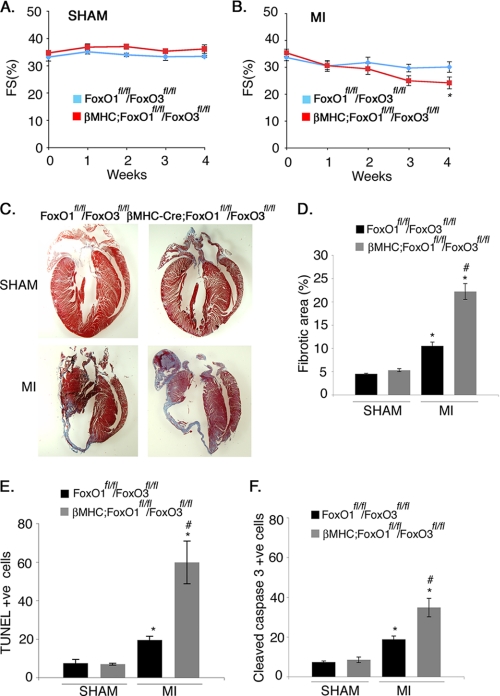
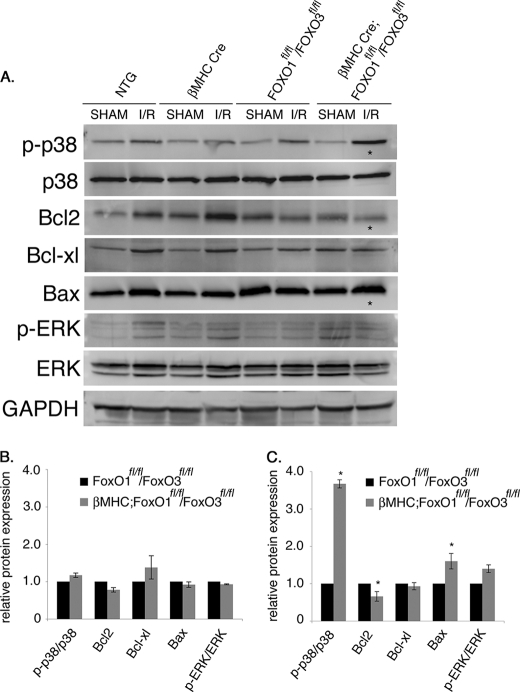
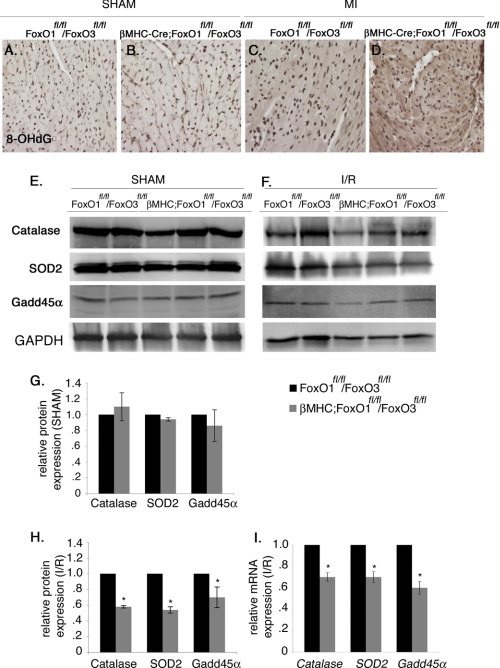
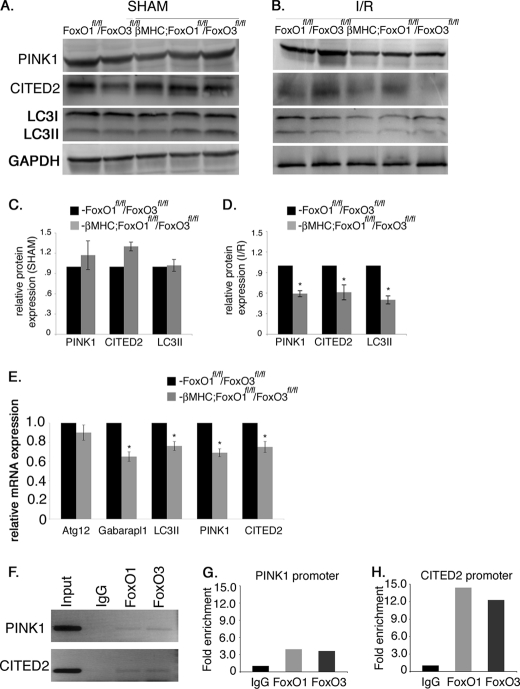
Transcriptional regulatory mechanisms of cardiac oxidative stress resistance are not well defined. FoxO transcription factors are critical mediators of oxidative stress resistance in multiple cell types, but cardioprotective functions have not been reported previously. FoxO function in oxidative stress resistance was investigated in cultured cardiomyocytes and in mice with cardiomyocyte-specific combined deficiency of FoxO1 and FoxO3 subjected to myocardial infarction (MI) or acute ischemia/reperfusion (I/R) injury. Induction of oxidative stress in cardiomyocytes promotes FoxO1 and FoxO3 nuclear localization and target gene activation. Infection of cardiomyocytes with a dominant-negative FoxO1(Δ256) adenovirus results in a significant increase in reactive oxygen species and cell death, whereas increased FoxO1 or FoxO3 expression reduces reactive oxygen species and cell death. Mice generated with combined conditional deletion of FoxO1 and FoxO3 specifically in cardiomyocytes were subjected to I/R or MI. Loss of FoxO1 and FoxO3 in cardiomyocytes results in a significant increase in infarct area with decreased expression of the antiapoptotic molecules, PTEN-induced kinase1 (PINK1) and CBP/P300-interacting transactivator (CITED2). Expressions of the antioxidants catalase and manganese superoxide dismutase-2 (SOD2) and the autophagy-related proteins LC3II and Gabarapl1 also are decreased following I/R compared with controls. Mice with cardiomyocyte-specific FoxO deficiency subjected to MI have reduced cardiac function, increased scar formation, induction of stress-responsive signaling, and increased apoptotic cell death relative to controls. These data support a critical role for FoxOs in promoting cardiomyocyte survival during conditions of oxidative stress through induction of antioxidants and cell survival pathways.


Figures

FIGURE 1.
FIGURE 1.
Induction of oxidative stress promotes nuclear localization of endogenous FoxO1 and FoxO3 and activation of FoxO target genes in rat neonatal cardiomyocytes. A–D, neonatal rat cardiomyocytes were subjected to glucose-free hypoxia overnight followed by 5 h of reoxygenation (H/R) (B and D) compared with control cardiomyocytes cultured in serum containing DMEM (A and C) (Normoxia). Expression and localization of FoxO1 (A and B) and FoxO3 (C and D) were determined by immunohistochemistry. Nuclear localization of FoxO1 (B) and FoxO3 (D) are indicated by black arrows in cardiomyocytes subjected to H/R stress. E–G, protein expression of p-AMPK/AMPK, p-FoxO1/FoxO1, p-FoxO3/FoxO3, and different FoxO target gene products, catalase, SOD2, PINK1, and LC3II were determined by Western blot and quantified from three independent experiments from normoxic, H2O2-treated, and H/R cardiomyocytes. The value of normoxic protein expression is set to 1.0, and the fold change was determined for H/R and H2O2-treated cells compared with normoxic condition. Significance was determined by Student's t test (*, p < 0.05, n = 3).
FIGURE 2.
FIGURE 2.
FoxO function is necessary and sufficient to promote cardiomyocyte cell survival during oxidative stress. A–J, neonatal cardiomyocytes were infected with ADA, TmO3, Δ256, or β-galactosidase adenovirus for 24 h and then treated with H2O2 for 2 h (E–H). Oxidative stress-induced cell death was determined by TUNEL assay (green TUNEL-positive cells indicated by arrows in B–D and F–H). I, quantitative representation of A–H. J, oxidative stress-induced ROS production was determined in cardiomyocytes treated with H2O2 for 30 min by using the fluorescence marker 2′,7′-dichlorodihydrofluorescein diacetate. Significance was determined by Student's t test (*, p < 0.05 versus without H2O2 treatment; #, p < 0.05 versus β-gal infected with H2O2 treatment, n = 3).
FIGURE 3.
FIGURE 3.
βMHC-Cre;FoxO1fl/fl/FoxO3fl/fl mice have increased ischemic injury. A, Western blot assessment of total protein expression of both FoxO1 and FoxO3 in control (FoxO1fl/flFoxO3fl/fl) and cardiomyocyte-specific FoxO1- and FoxO3-deficient (βMHC-Cre;FoxO1fl/fl/FoxO3fl/fl) mouse hearts. B and C, quantitative representation of A showing 70% reduction of both FoxO1 and FoxO3 in βMHC-Cre;FoxO1fl/fl/FoxO3fl/fl mouse hearts compared with FoxO1fl/fl/FoxO3fl/fl controls. D and E, NTG, βMHC-Cre, FoxO1fl/fl/FoxO3fl/fl, and βMHC-Cre;FoxO1fl/fl/FoxO3fl/fl mouse hearts were subjected to 1 h of ischemia followed by 24 h of reperfusion and were stained with triphenyltetrazolium chloride and Evan's blue dye to determine cell viability and the area at risk. Quantification of infarct area (IA) versus AAR shows significant increase in percentage of I/R injury with no significant changes in AAR in βMHC-Cre;FoxO1fl/fl/FoxO3fl/fl compared with NTG, βMHC-Cre, and FoxO1fl/fl/FoxO3fl/fl mouse hearts. Significance was determined by Student's t test (*, p < 0.05; for NTG, n = 6, βMHC-Cre, n = 7, FoxO1fl/fl/FoxO3fl/fl, n = 7, and for βMHC-Cre;FoxO1fl/fl/FoxO3fl/fl, n = 8).
FIGURE 4.
FIGURE 4.
Cardiomyocyte-specific loss of both FoxO1 and FoxO3 leads to increased scar formation and cell death with attenuated cardiac performance following MI. A and B, echocardiographic analysis of fractional shortening in FoxO1fl/fl/FoxO3fl/fl and βMHC-Cre;FoxO1fl/fl/FoxO3fl/fl mice subjected to sham or MI surgical procedure for 4 weeks. Statistical significance was determined by one-way analysis of variance (*, p < 0.05 versus sham, n = 4–7). C, Masson's trichrome-stained histological sections of hearts from FoxO1fl/fl/FoxO3fl/fl and βMHC-Cre;FoxO1fl/fl/FoxO3fl/fl mice subjected to the sham or MI surgical procedure for 4 weeks. The scar area is shown in blue. D, quantitative representation of C showing significant increased in the percentage of fibrotic area in βMHC-Cre;FoxO1fl/fl/FOXO3fl/fl compared with FoxO1fl/fl/FoxO3fl/fl mice. E and F, quantitative representation of cell death as determined by the immunohistochemical staining with TUNEL or cleaved caspase-3-specific antibody in FoxO1fl/fl/FoxO3fl/fl and βMHC-Cre;FoxO1fl/fl/FoxO3fl/fl mice subjected to the sham or MI surgical procedure for 4 weeks. Cell death evaluated by both TUNEL (E) and cleaved caspase-3 (F) is increased in βMHC-Cre;FoxO1fl/fl/FoxO3fl/fl compared with FoxO1fl/fl/FoxO3fl/fl mice. Significance was determined by Student's t test (*, p < 0.05 versus sham and #, p < 0.05 versus MI, n = 6).
FIGURE 5.
FIGURE 5.
p38 MAPK activation is enhanced in βMHC-Cre;FoxO1fl/fl/FoxO3fl/fl compared with NTG, βMHC-Cre, and FoxO1fl/fl/FoxO3fl/fl control mice following acute I/R injury. A–C, Western blot assessment of p38 MAPK signaling, ERK signaling, and apoptotic regulatory proteins in NTG, βMHC-Cre, FoxO1fl/fl/FoxO3fl/fl, and βMHC-Cre;FoxO1fl/fl/FoxO3fl/fl hearts following sham operation or acute I/R. The asterisks show significant increased p38 phosphorylation (p-p38), decreased Bcl2, and increased Bax expression following I/R injury in βMHC-Cre;FoxO1fl/fl/FoxO3fl/fl hearts compared with NTG, βMHC-Cre, and FoxO1fl/fl/FoxO3fl/fl controls. No significant changes were observed after the sham procedure among four different genotypes. B and C are the quantitative representation of protein levels of NTG, βMHC-Cre, FoxO1fl/fl/FoxO3fl/fl, and βMHC-Cre;FoxO1fl/fl/FoxO3fl/fl following sham (B) and I/R (C) procedure. Significance was determined by Student's t test (*, p < 0.05, n = 3).
FIGURE 6.
FIGURE 6.
Expression of cardioprotective antioxidants catalase, SOD2, and Gadd45α is decreased in βMHC-Cre;FoxO1fl/fl/FoxO3fl/fl compared with FoxO1fl/fl/FoxO3fl/fl mice following MI and I/R injury. A–D, heart sections were subjected to immunostaining with 8-OHdG, a marker of oxidative DNA damage, which was increased in βMHC-Cre;FoxO1fl/fl/FoxO3fl/fl compared with FoxO1fl/fl/FoxO3fl/fl mice (indicated by dark brown staining in D compared with C), although no noticeable changes were observed after sham procedure (compare A and B). E–H, heart lysates were used to examine the protein expression of catalase, SOD2, and Gadd45α. Immunoblot analyses show a significant decrease in the protein expression of catalase, SOD2, and Gadd45α in βMHC-Cre;FoxO1fl/fl/FoxO3fl/fl compared with FoxO1fl/fl/FoxO3fl/fl mice (F and H), and no significant changes were observed after the sham procedure (E and G). I, relative gene expression of Cat, SOD2, and Gadd45α was determined by real time qRT-PCR in βMHC-Cre;FoxO1fl/fl/FoxO3fl/fl and FoxO1fl/fl/FoxO3fl/fl mice. Significance was determined by Student's t test (*, p < 0.05; for FoxO1fl/fl/FoxO3fl/fl, n = 4, and for βMHC-Cre;FoxO1fl/fl/FoxO3fl/fl, n = 6).
FIGURE 7.
FIGURE 7.
Expression of anti-apoptotic and autophagy-related genes are decreased in βMHC-Cre;FoxO1fl/fl/FoxO3fl/fl compared with FoxO1fl/fl/FoxO3fl/fl mice following I/R injury. A–D, heart lysates were used to examine the protein expression of anti-apoptotic proteins PINK1, CITED2, and an autophagy-related protein LC3II. Immunoblot analyses show a significant decrease in the protein expression of PINK1, CITED2, and LC3II in βMHC-Cre;FoxO1fl/fl/FoxO3fl/fl compared with FoxO1fl/fl/FoxO3fl/fl mice (B) with no significant changes observed after sham procedure (A). C and D are the quantitative representation of A and B, respectively. E, relative gene expression of PINK1, CITED2, LC3II, ATG12, and Gabarapl1 was determined by real time qRT-PCR in βMHC-Cre;FoxO1fl/fl/FoxO3fl/fl and FoxO1fl/fl/FoxO3fl/fl mice. Significance was determined by Student's t test (*, p < 0.05; for FoxO1fl/fl/FoxO3fl/fl, n = 4, and for βMHC-Cre;FoxO1fl/fl/FoxO3fl/fl, n = 6). F, ChIP assay demonstrates that both FoxO1 and FoxO3 bind to the promoter regions of PINK1 and CITED2 under H/R conditions. G and H, graphs are fold enrichment relative to background (IgG antibody control) as determined by qPCR.

Similar articles

Cited by

References

    1. Murphy E., Steenbergen C. (2008) Physiol. Rev. 88, 581–609 - PMC - PubMed
    1. Finkel T., Holbrook N. J. (2000) Nature 408, 239–247 - PubMed
    1. Alcendor R. R., Gao S., Zhai P., Zablocki D., Holle E., Yu X., Tian B., Wagner T., Vatner S. F., Sadoshima J. (2007) Circ. Res. 100, 1512–1521 - PubMed
    1. Wang Y., Gao E., Tao L., Lau W. B., Yuan Y., Goldstein B. J., Lopez B. L., Christopher T. A., Tian R., Koch W., Ma X. L. (2009) Circulation 119, 835–844 - PMC - PubMed
    1. Evans-Anderson H. J., Alfieri C. M., Yutzey K. E. (2008) Circ. Res. 102, 686–694 - PubMed

Publication types

MeSH terms