Neighbourhood continuity is not required for correct testis gene expression in Drosophila
- PMID: 21151342
- PMCID: PMC2994658
- DOI: 10.1371/journal.pbio.1000552
Neighbourhood continuity is not required for correct testis gene expression in Drosophila
Abstract
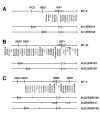
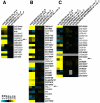
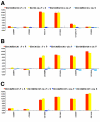
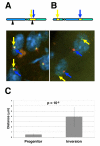
It is now widely accepted that gene organisation in eukaryotic genomes is non-random and it is proposed that such organisation may be important for gene expression and genome evolution. In particular, the results of several large-scale gene expression analyses in a range of organisms from yeast to human indicate that sets of genes with similar tissue-specific or temporal expression profiles are clustered within the genome in gene expression neighbourhoods. While the existence of neighbourhoods is clearly established, the underlying reason for this facet of genome organisation is currently unclear and there is little experimental evidence that addresses the genomic requisites for neighbourhood organisation. We report the targeted disruption of three well-defined male-specific gene expression neighbourhoods in the Drosophila genome by the synthesis of precisely mapped chromosomal inversions. We compare gene expression in individuals carrying inverted chromosomes with their non-inverted but otherwise identical progenitors using whole-transcriptome microarray analysis, validating these data with specific quantitative real-time PCR assays. For each neighbourhood we generate and examine multiple inversions. We find no significant differences in the expression of genes that define each of the neighbourhoods. We further show that the inversions spatially separate both halves of a neighbourhood in the nucleus. Thus, models explaining neighbourhood organisation in terms of local sequence interactions, enhancer crosstalk, or short-range chromatin effects are unlikely to account for this facet of genome organisation. Our study challenges the notion that, at least in the case of the testis, expression neighbourhoods are a feature of eukaryotic genome organisation necessary for correct gene expression.
Conflict of interest statement
The authors have declared that no competing interests exist.
Figures


Similar articles
-
Changes of Osvaldo expression patterns in germline of male hybrids between the species Drosophila buzzatii and Drosophila koepferae.Mol Genet Genomics. 2015 Aug;290(4):1471-83. doi: 10.1007/s00438-015-1012-z. Epub 2015 Feb 25. Mol Genet Genomics. 2015. PMID: 25711309
-
tBRD-1 selectively controls gene activity in the Drosophila testis and interacts with two new members of the bromodomain and extra-terminal (BET) family.PLoS One. 2014 Sep 24;9(9):e108267. doi: 10.1371/journal.pone.0108267. eCollection 2014. PLoS One. 2014. PMID: 25251222 Free PMC article.
-
Analysis of Drosophila melanogaster testis transcriptome.BMC Genomics. 2018 Sep 24;19(1):697. doi: 10.1186/s12864-018-5085-z. BMC Genomics. 2018. PMID: 30249207 Free PMC article.
-
Primary transcripts: From the discovery of RNA processing to current concepts of gene expression - Review.Exp Cell Res. 2018 Dec 15;373(1-2):1-33. doi: 10.1016/j.yexcr.2018.09.011. Epub 2018 Sep 26. Exp Cell Res. 2018. PMID: 30266658 Review.
-
Genome architecture: from linear organisation of chromatin to the 3D assembly in the nucleus.Chromosoma. 2016 Jun;125(3):455-69. doi: 10.1007/s00412-015-0538-5. Epub 2015 Sep 2. Chromosoma. 2016. PMID: 26330112 Review.
Cited by
-
Effects of Gene Dose, Chromatin, and Network Topology on Expression in Drosophila melanogaster.PLoS Genet. 2016 Sep 6;12(9):e1006295. doi: 10.1371/journal.pgen.1006295. eCollection 2016 Sep. PLoS Genet. 2016. PMID: 27599372 Free PMC article.
-
Photosynthetic protein classification using genome neighborhood-based machine learning feature.Sci Rep. 2020 Apr 28;10(1):7108. doi: 10.1038/s41598-020-64053-w. Sci Rep. 2020. PMID: 32346070 Free PMC article.
-
Independence of chromatin conformation and gene regulation during Drosophila dorsoventral patterning.Nat Genet. 2021 Apr;53(4):487-499. doi: 10.1038/s41588-021-00799-x. Epub 2021 Apr 1. Nat Genet. 2021. PMID: 33795866 Free PMC article.
-
Altering enhancer-promoter linear distance impacts promoter competition in cis and in trans.Genetics. 2022 Aug 30;222(1):iyac098. doi: 10.1093/genetics/iyac098. Genetics. 2022. PMID: 35748724 Free PMC article.
-
Highly rearranged chromosomes reveal uncoupling between genome topology and gene expression.Nat Genet. 2019 Aug;51(8):1272-1282. doi: 10.1038/s41588-019-0462-3. Epub 2019 Jul 15. Nat Genet. 2019. PMID: 31308546 Free PMC article.
References
-
- Milot E, Strouboulis J, Trimborn T, Wijgerde M, de Boer E, et al. Heterochromatin effects on the frequency and duration of LCR-mediated gene transcription. Cell. 1996;87:105–114. - PubMed
-
- Cho R. J, Campbell M. J, Winzeler E. A, Steinmetz L, Conway A, et al. A genome-wide transcriptional analysis of the mitotic cell cycle. Mol Cell. 1998;2:65–73. - PubMed
-
- Cohen B. A, Mitra R. D, Hughes J. D, Church G. M. A computational analysis of whole-genome expression data reveals chromosomal domains of gene expression. Nat Genet. 2000;26:183–186. - PubMed
Publication types
MeSH terms
Grants and funding
LinkOut - more resources
Full Text Sources
Molecular Biology Databases

