

MCPH1 patient cells exhibit delayed release from DNA damage-induced G2/M checkpoint arrest
- PMID: 21150325
- PMCID: PMC3047812
- DOI: 10.4161/cc.9.24.14157
MCPH1 patient cells exhibit delayed release from DNA damage-induced G2/M checkpoint arrest
Abstract
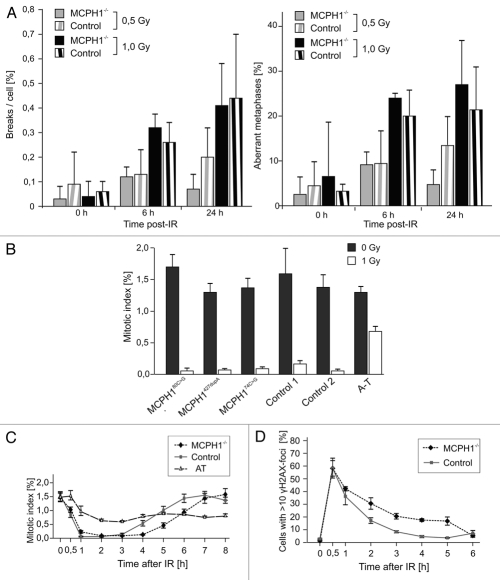
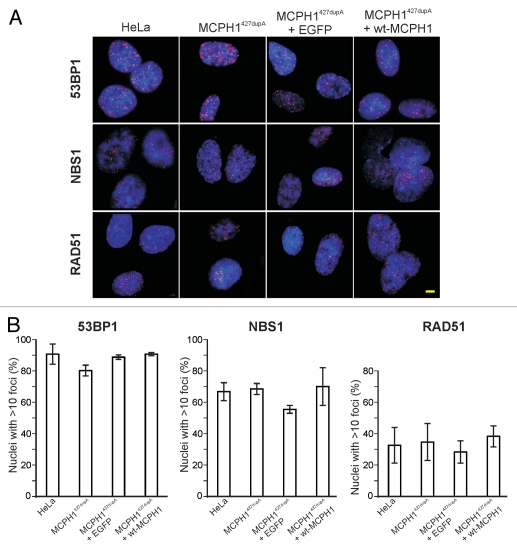
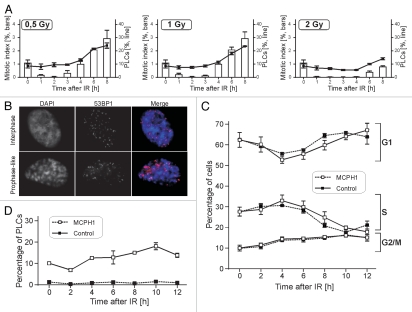
Mutations in the MCPH1 gene cause primary microcephaly associated with a unique cellular phenotype of misregulated chromosome condensation. The encoded protein contains three BRCT domains, and accumulating data show that MCPH1 is involved in the DNA damage response. However, most of this evidence has been generated by experiments using RNA interference (RNAi) and cells from non-human model organisms. Here, we demonstrate that patient-derived cell lines display a proficient G2/M checkpoint following ionizing irradiation (IR) despite homozygous truncating mutations in MCPH1. Moreover, chromosomal breakage rates and the relocation to DNA repair foci of several proteins functioning putatively in an MCPH1-dependent manner are normal in these cells. However, the MCPH1-deficient cells exhibit a slight delay in re-entering mitosis and delayed resolution of γH2AX foci following IR. Analysis of chromosome condensation behavior following IR suggests that these latter observations may be related to hypercondensation of the chromatin in cells with MCPH1 mutations. Our results indicate that the DNA damage response in human cells with truncating MCPH1 mutations differs significantly from the damage responses in cells of certain model organisms and in cells depleted of MCPH1 by RNAi. These subtle effects of human MCPH1 deficiency on the cellular DNA damage response may explain the absence of cancer predisposition in patients with biallelic MCPH1 mutations.
Figures
Similar articles
-
A novel MCPH1 isoform complements the defective chromosome condensation of human MCPH1-deficient cells.PLoS One. 2012;7(8):e40387. doi: 10.1371/journal.pone.0040387. Epub 2012 Aug 30. PLoS One. 2012. PMID: 22952573 Free PMC article.
-
Establishment of a mouse model with misregulated chromosome condensation due to defective Mcph1 function.PLoS One. 2010 Feb 16;5(2):e9242. doi: 10.1371/journal.pone.0009242. PLoS One. 2010. PMID: 20169082 Free PMC article.
-
Misregulated chromosome condensation in MCPH1 primary microcephaly is mediated by condensin II.Cell Cycle. 2006 Feb;5(3):322-6. doi: 10.4161/cc.5.3.2412. Epub 2006 Feb 1. Cell Cycle. 2006. PMID: 16434882
-
Microcephalin: a causal link between impaired damage response signalling and microcephaly.Cell Cycle. 2006 Oct;5(20):2339-44. doi: 10.4161/cc.5.20.3358. Epub 2006 Oct 16. Cell Cycle. 2006. PMID: 17102619 Review.
-
The DNA damage response molecule MCPH1 in brain development and beyond.Acta Biochim Biophys Sin (Shanghai). 2016 Jul;48(7):678-85. doi: 10.1093/abbs/gmw048. Epub 2016 May 19. Acta Biochim Biophys Sin (Shanghai). 2016. PMID: 27197793 Review.
Cited by
-
Microcephalin 1/BRIT1-TRF2 interaction promotes telomere replication and repair, linking telomere dysfunction to primary microcephaly.Nat Commun. 2020 Nov 17;11(1):5861. doi: 10.1038/s41467-020-19674-0. Nat Commun. 2020. PMID: 33203878 Free PMC article.
-
The analyses of human MCPH1 DNA repair machinery and genetic variations.Open Med (Wars). 2024 Feb 29;19(1):20240917. doi: 10.1515/med-2024-0917. eCollection 2024. Open Med (Wars). 2024. PMID: 38463519 Free PMC article.
-
Rare copy number variants observed in hereditary breast cancer cases disrupt genes in estrogen signaling and TP53 tumor suppression network.PLoS Genet. 2012;8(6):e1002734. doi: 10.1371/journal.pgen.1002734. Epub 2012 Jun 21. PLoS Genet. 2012. PMID: 22737080 Free PMC article.
-
Chromosome structure deficiencies in MCPH1 syndrome.Chromosoma. 2015 Dec;124(4):491-501. doi: 10.1007/s00412-015-0512-2. Epub 2015 Apr 7. Chromosoma. 2015. PMID: 25845520
-
A novel MCPH1 isoform complements the defective chromosome condensation of human MCPH1-deficient cells.PLoS One. 2012;7(8):e40387. doi: 10.1371/journal.pone.0040387. Epub 2012 Aug 30. PLoS One. 2012. PMID: 22952573 Free PMC article.
References
-
- Trimborn M, Schindler D, Neitzel H, Hirano T. Misregulated chromosome condensation in MCPH1 primary microcephaly is mediated by condensin II. Cell Cycle. 2006;5:322–326. - PubMed
Publication types
MeSH terms
Substances
LinkOut - more resources
Full Text Sources