. 2011 Apr;23(4):673-82.
doi: 10.1016/j.cellsig.2010.11.021. Epub 2010 Dec 3.

Neuronal pentraxin 1 induction in hypoxic-ischemic neuronal death is regulated via a glycogen synthase kinase-3α/β dependent mechanism

Affiliations

Neuronal pentraxin 1 induction in hypoxic-ischemic neuronal death is regulated via a glycogen synthase kinase-3α/β dependent mechanism

Juliet C Russell et al. Cell Signal. 2011 Apr.

Abstract

Intracellular signaling pathways that regulate the production of lethal proteins in central neurons are not fully characterized. Previously, we reported induction of a novel neuronal protein neuronal pentraxin 1 (NP1) in neonatal brain injury following hypoxia-ischemia (HI); however, how NP1 is induced in hypoxic-ischemic neuronal death remains elusive. Here, we have elucidated the intracellular signaling regulation of NP1 induction in neuronal death. Primary cortical neurons showed a hypoxic-ischemia time-dependent increase in cell death and that NP1 induction preceded the actual neuronal death. NP1 gene silencing by NP1-specific siRNA significantly reduced neuronal death. The specificity of NP1 induction in neuronal death was further confirmed by using NP1 (-/-) null primary cortical neurons. Declines in phospho-Akt (i.e. deactivation) were observed concurrent with decreased phosphorylation of its downstream substrate GSK-3α/β (at Ser21/Ser9) (i.e. activation) and increased GSK-3α and GSK-3β kinase activities, which occurred prior to NP1 induction. Expression of a dominant-negative inhibitor of Akt (Akt-kd) blocked phosphorylation of GSK-3α/β and subsequently enhanced NP1 induction. Whereas, overexpression of constitutively activated Akt (Akt-myr) or wild-type Akt (wtAkt) increased GSK-α/β phosphorylation and attenuated NP1 induction. Transfection of neurons with GSK-3α siRNA completely blocked NP1 induction and cell death. Similarly, overexpression of the GSK-3β inhibitor Frat1 or the kinase mutant GSK-3βKM, but not the wild-type GSK-3βWT, blocked NP1 induction and rescued neurons from death. Our findings clearly implicate both GSK-3α- and GSK-3β-dependent mechanism of NP1 induction and point to a novel mechanism in the regulation of hypoxic-ischemic neuronal death.


Figures

Fig. 1
Fig. 1
Hypoxic-ischemic exposure of primary cortical neurons resulted NP1 induction and substantial neuronal death. A) Morphological evidence of injury and death in cortical neurons after 10 h of hypoxic-ischemic exposure. Scale bar 20 μm. B) Hypoxic-ischemic time- dependent DNA damage in primary cortical neurons. Representative images from the comet assay are shown. ‘Tails’ can be observed at 2 h of exposure and continues to increase upto 8 h due to the difference in mobility of denatured cleaved DNA fragments, indicating DNA damage. C) Total cellular proteins (20 μg/lane) were analyzed by SDS-PAGE and immunoblotted for NP1 protein. Chemiluminescent detection showed an intense NP1 immunoreactive protein band at ~47 kDa and bands were quantified by densitometry and normalized to actin (mean ± SEM, n=4; *p<0.01). D) Quantification of cell death by LDH release revealed cell death with ~30–40% cell death occurring at 6–8 h of exposure. Data is expressed as percent LDH release from control normoxic cells (mean ± SEM, n=8; *p<0.05, **p<0.01).
Fig. 2
Fig. 2
Knockdown of NP1 by siRNA targeted against NP1 mRNA protected against hypoxic-ischemic neuronal death. A) Western immunoblot analysis of total cellular extracts using NP1 primary antibody (1:500) and densitometric quantification of NP1 bands revealed complete abolishment of NP1 protein levels in cells transfected with NP1-siRNA. Mean SEM (n=4; *p <0.01 vs. scrambled siRNA). Representative blots are shown. B) Magnitude of cell death after 8 h of exposure was assessed by LDH release cytotoxicity. NP1-siRNA significantly reduced cell toxicity compared to control scramble-transfected cells. Data represents mean ± SEM (n=8; *p <0.01, vs. normoxia control; +p <0.01 vs. respective hypoxia group. C) TUNEL-staining of cortical neurons transfected with either control scramble or NP1-siRNA and exposed to hypoxic- ischemic condition (8 h). Quantification of TUNEL (+) cells (green) over total cells (DAPI staining; blue) revealed 5-fold increased TUNEL (+) cell in scramble siRNA transfected cells, which was significantly reduced in cells transfected with NP1-siRNA. Representative TUNEL (+) cells are shown. Values represent mean ± SEM (n=5) relative to controls (*p<0.01 vs. normoxia control; +p<0.01 vs. scrambled siRNA group).
Fig. 3
Fig. 3
NP1 (−/−) null primary cortical neurons are significantly protected against hypoxic-ischemia induced neuronal death. Primary cortical neurons (WT and NP-KO cultures) were exposed to OGD at DIV 10 for 4–6 h. LDH cytotoxicity assay showed significantly less cell death in NP1 −/− cells vs. WT cells. Whereas, reintroduction of NP1 into NP1 −/− neurons further enhanced LDH release. Data are expressed as percentage of control cells (normoxia vs. OGD) mean ± SEM; n=8; *p<0.01 vs. WT. **p<0.001 and ***p<0.01 vs. parent WT and NP1-KO, respectively.
Fig. 4
Fig. 4
GSK-3 α/β dephosphorylation (i.e. activation) occurred concurrent with Akt kinase deactivation following hypoxic-ischemic exposure and resulted induction of NP1 in neuronal death. A) Total protein extracts from hypoxic-ischemic and control cortical cultures were collected at indicated time points, resolved by SDS/PAGE and immunoblotted with phospho (Ser473)-specific Akt and total Akt antibodies. Deactivation of Akt is indicated by the decreased p-Akt/total Akt ratio. Data represent mean SEM (n=4–5; *p<0.001 vs. control Akt activity. Western blot analyses were performed using antibodies specific for phospho (Ser21/9)-specific GSK-3 α/β, total GSK-3/(B) and NP1 normalized to actin (C) as described in the “Experimental Procedures”. Results show decreased p-GSK-3 α/β/total GSK-3 α/β ratio (i.e. activation) followed by significant accumulation of NP1 protein levels at 4 h onset. Data represent mean ± SEM (n=5; +P<0.05, ++p,<0.001 vs. control NP1; *p<0.001 vs. control GSK-3 α/β. Controls are taken as 100%. Representative blots are shown.
Fig. 5
Fig. 5
Increase in GSK-3α and GSK-3β activities in hypoxic-ischemic cortical neurons. Total cellular extracts were prepared from control and hypoxic-ischemic cells and immunoprecipitated with GSK-3α - and GSK-3β-specific antibodies. GSK-3α - and GSK-3β activity was assayed separately as described under the Experimental procedures”. Results showed hypoxia time-dependent increase in kinase activity of both GSK- 3α and GSK-3β in cortical neurons. Data are mean ± SEM (n=4; *p<0.01, **p<0.001 vs. control normoxia group.
Fig. 6
Fig. 6
Inhibition of Akt kinase is required for GSK-3 α/β activation and subsequent NP1 induction. Primary cortical neuronal cultures were transfected with control CMV, Akt-myr, Akt-kd or wtAkt plasmid DNA (2 μg) as described in the “Experimental Procedures”. Total cellular extracts were prepared after hypoxia as indicated and analyzed by SDS/PAGE electrophoresis. Western immunoblotting was performed (A) with total and phospho (Ser21/9)-specific GSK- 3 α/β, and (B) with NP1 and actin antibodies. Densitometric quantification show increased accumulation of NP1 levels and decreased ratio p-GSK-3 α/β/total GSK-3 α/β following inhibition of Akt kinase by Akt-kd. Data represent mean ± SEM (n=4; *p<0.01 vs. control CMV; +p<0.01 vs. CMV + Hypoxia; and **p <0.001 vs. Akt-myr + Hypoxia group. Controls are taken as 100%. C) Cells were pretreated with varying concentrations (0–250nM) of GSK-3 inhibitor IX for 8–10 h. Total cellular extract were analyzed by Western blot analyses. Data represent mean ± SEM (n=4; +P<0.05, ++p<0.001 vs. control). Representative blots are shown.
Fig. 7
Fig. 7
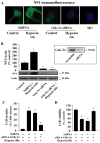
Knockdown of GSK-3α by GSK-3α-specific siRNA blocked NP1 expression. Primary cortical cultures at DIV 6 were transfected with either control scramble siRNA or GSK-3α-siRNA and exposed to hypoxic-ischemic condition as described under “Experimental procedures”. A) Immunofluorescence microscopy demonstrates almost complete inhibition of NP1expression in cells transfected with GSK-3α-siRNA that completely knockdown GSK-3α (not shown). IgG immunofluorescence (−ve control) show no evidence of NP1 protein. B) Western immunoblotting of total cellular proteins and densitometric quantification (normalized to actin) show significant abolishment of NP1 protein accumulation in GSK-3α-siRNA compared to that in control scramble siRNA transfected cells. Data are mean ± SEM (n=4; *p<0.01 vs. control; +p<0.01 vs. Scramble siRNA + Hypoxia) of control taken as 100%. Representative blots are shown. Neuronal death was assessed independently by complementary LDH release cytotoxicity (C) and MTT reduction cell viability assays (D). Inhibition of GSK-3α significantly reduced cell toxicity and increased cell viability (mean ± SEM, n=8; *p<0.01 vs. control normoxic cells, +p<0.01 vs. hypoxia + control scramble siRNA transfected group).
Fig. 8
Fig. 8
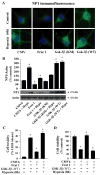
Inhibition of GSK-3β function inhibits induction of NP1 in hypoxic-ischemic cortical neurons. Cortical neurons were transfected with control CMV, dominant-negative inhibitor Frat 1,kinase mutant GSK-3β (GSK-3βKM) or WT-GSK-3β (GSK-3βWT) plasmid DNA (2 μg) as described under “Experimental procedures”. Fluorescence microscopy (A) and Western immunoblotting with NP1 antibody showed effective inhibition of GSK-3β by Frat1 that resulted significant decrease in NP1 accumulation. Whereas, overexpression of the GSK-3βWT significantly enhanced NP1 expression. Data represent mean ± SEM (n=4; *p<0.001 vs. control CMV6 and +p <0.001 vs. Frat1 + Hypoxia group. Representative blots are shown. Neuronal death was assessed by LDH release cytotoxicity (C) and MTT reduction cell viability assays (D). Inhibition of GSK-3β significantly reduced cell toxicity and increased cell viability (mean ± SEM, n=8; *p<0.01 vs. control normoxic cells, +p<0.01 vs. hypoxia + control CMV6 transfected group).

Similar articles

Cited by

References

    1. Lorenz JM, Wooliever DE, Jetton JR, Paneth N. Arch Pediatr Adolesc Med. 1998;152(5):425–435. - PubMed
    1. Northington FJ, Ferriero DM, Flock DL, Martin LJ. J Neurosci. 2001;21(6):1931–1938. - PMC - PubMed
    1. Northington FJ, Ferriero DM, Martin LJ. Dev Neurosci. 2001;23(3):186–191. - PubMed
    1. Johnston MV. Brain Dev. 1997;19(4):235–239. - PubMed
    1. Volpe JJ. Ment Retard Dev Disabil Res Rev. 2001;7(1):56–64. - PubMed

Publication types

MeSH terms