. 2011 Feb 15;434(1):83-92.
doi: 10.1042/BJ20101358.

Target genes of the largest human SWI/SNF complex subunit control cell growth

Affiliations

Target genes of the largest human SWI/SNF complex subunit control cell growth

Hiroko Inoue et al. Biochem J. .

Abstract

The largest subunit of the mammalian SWI/SNF-A or BAF (BRG1-associated factor) chromatin-remodelling complex is encoded by two related cDNAs hOsa1/BAF250a and hOsa2/BAF250b that are unique to the BAF complex and absent in the related PBAF (Polybromo BAF). hOsa/BAF250 has been shown to interact with transcriptional activators and bind to DNA suggesting that it acts to target the remodelling complex to chromatin. To better understand the functions of hOsa2, we established inducible stable HeLa cell lines over-expressing FLAG-hOsa2 or a derivative lacking the ARID (AT-rich interactive domain) DNA-binding domain. Immunopurification of complexes containing hOsa2 that was followed by mass spectrometry and immunoblotting demonstrated the presence of BRG1 and known BAFs, but not hOsa1 or hBRM. Deletion of the ARID did not compromise the integrity of the complex. Induction of hOsa2 expression caused impaired cell growth and accumulation of cells in the G0/G1 cell cycle phase. Elevated levels of the p53 and p21 proteins were detected in these cells while c-Myc mRNA and protein levels were found to decrease. Chromatin immunoprecipitation and reporter assays suggested that hOsa2 had a direct effect on c-myc and p21 promoter activity. Thus hOsa2 plays an important role in controlling genes regulating the cell cycle.


Figures
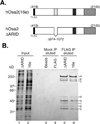
Figure 1
Figure 1. Purification of protein complexes associated with hOsa2 and hOsa2ΔARID
(A) The domain structure of FLAG-tagged hOsa2 (16e) and derivative hOsa2ΔARID lacking the DNA-binding domain ARID. The three shaded regions are conserved between human and Drosophila Osa protein as described previously [13]. (B) HeLa Tet-off cells induced to express FLAG–hOsa2 (cell line 16eC3) or FLAG-hOsa2ΔARID were used to purify hOsa2-associated proteins. Nuclear extracts were loaded on to a glycerol gradient and fractions containing hOsa2 (lower third of the gradient) were pooled and subjected to immunopurification with anti-FLAG antibody and elution with FLAG peptide. The input represents 0.25% of the pooled gradient fractions (lanes 1 and 2). Mock IP (immunoprecipitation) was performed with Protein G beads (lanes 3 and 4) and eluted using the same conditions as with the anti-FLAG antibody (lanes 5 and 6). Protein bands labelled a-h were excised and subjected to analysis by mass spectrometry. Peptides for the following SWI/SNF subunits were identified: hOsa2 (a), BRG1 (a), BAF170 (b), BAF155 (b and c) and BAF60 (e). The recovery of peptides from bands d and f–h was insufficient for positive identification. The molecular mass in kDa is indicated on the left-hand side.
Figure 2
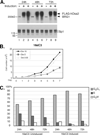
Figure 2. Induced expression of hOsa2 results in impaired cell growth and accumulation of cells in the G1 phase
(A) Nuclear extracts were prepared from 16eC3 cells uninduced (lanes 1, 4 and 7) or induced to express FLAG–hOsa2 (lanes 2, 5 and 8: 0.01 ng/ml Dox; lanes 3, 6 and 9: 0 ng/ml Dox). Shown is an immunoblot probed sequentially with antibodies against FLAG, BRG1 and Sp1. The molecular mass in kDa is indicated on the left-hand side. (B) 16eC3 cells were plated at 5×10⁵ cells per plate in 10 ng/ml Dox and induced the next day (day 0, Dox 0, 0 ng/ml) or left uninduced (day 0, Dox 10, 10 ng/ml). The total cell number was determined each day for a period of 7 days. Cells induced to overexpress hOsa2 showed a substantial and increased reduction in cell number compared with uninduced cells. The cell number did not change in the control cells that were treated similarly with Dox (results not shown). Cells that were induced on day 0, but were refed in a medium containing 30 ng/ml Dox on day 2 (Dox 0–30) to shut down hOsa2 expression, showed a partial recovery in cell number. Similar results were obtained with an independent cell line 16eC8. (C) Uninduced and induced 16eC3 cells were subjected to DNA staining and flow cytometry. Upon removal of Dox, 16eC3 cells and 16eC8 cells (results not shown) accumulated in the G0/G1 phase of the cell cycle. The control cells showed no change in cell cycle distribution in the same experiment (results not shown).
Figure 3
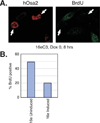
Figure 3. Induced expression of hOsa2 decreases BrdU incorporation
(A) 16eC3 cells induced for 8h were labelled with BrdU for 2h then fixed and examined by indirect immunofluorescence with an antibody to hOsa2 or BrdU. These cells showed heterogeneous expression of hOsa2. The arrows point to those expressing hOsa2 at high levels. (B) Quantification of the percentage of BrdU positive cells in uninduced and induced 16eC3 cell cultures.
Figure 4
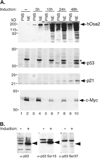
Figure 4. Changes in p53, p21 and c-Myc protein levels after induction of hOsa2
(A) 16eC3 cells were treated with Dox for the indicated hours and then were harvested and fractionated into NE (nuclear) and PNS fractions. Proteins were separated by SDS/PAGE and immunoblotted with antibodies against hOsa2, p53, p21, or c-Myc. Molecular size markers are indicated at left. (B) Lysates of 16eC3 cells induced for 24 h (+) were separated by SDS/PAGE and probed for total p53, p53 phospho-Serine 15, and p53 phospho-Serine 37. *Non-specific cross-reacting protein.
Figure 5
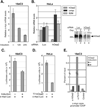
Figure 5. c-myc mRNA levels are reduced after the expression of hOsa2, but increased after the knockdown of endogenous hOsa2
(A) The total RNA prepared from16eC3 cells uninduced or induced for 0, 12 or 24 h was used in RT-PCR with primers corresponding to c-myc exon1. The value obtained for each reaction was normalized to that of 28S rRNA. The experiment was performed in duplicate and the spread of the mean is shown for each sample. (B) HeLa cells were transfected with siRNA against luciferase or hOsa2 by electroporation and the total RNA was prepared 48 h later. RT-PCRs were carried out using primers to hOsa2, c-myc and B2M. The experiment was performed in triplicate. The immunoblot on the right shows reduced levels of endogenous hOsa2 protein, 1 and 2 days after transfection of HeLa cells with siRNA. (C) 16eC3 cells were transiently transfected with a c-myc promoter–luciferase reporter plasmid (0.5 µg) using Lipofectamine™ Plus, and hOsa2 expression was induced 8 h later. The cells were harvested after 24 h and luciferase activity was measured and normalized to β-galactosidase activity from the co-transfected LacZ plasmid (0.25 µg). The assay was performed in triplicate. (D) HeLa cells were transiently transfected by the calcium phosphate precipitation method with a c-myc promoter–luciferase reporter plasmid (0.5 µg) and a plasmid expressing T7-hOsa2(16e) (1 µg). The cells were harvested after 48 h and the luciferase activity was measured and normalized to β-galactosidase activity from the co-transfected LacZ plasmid (0.25 µg). The experiment was performed in duplicate and the spread of the mean is shown for each sample. (E) 16eC3 cells uninduced ( − ) or induced for 24 h (+) were cross-linked with formaldehyde and a ChIP assay was performed using the indicated antibodies. The products were detected by real time PCR with primers specific for the c-myc core promoter region and plotted as percentage of input. The control antibody was anti-p21 antibody.
Figure 6
Figure 6. Activation of the p21 promoter upon co-expression of hOsa2
(A) 16eC3 and control cells were transiently transfected by the calcium phosphate precipitation method with a p21 promoter-driven luciferase reporter plasmid with the indicated amounts of DNA. The expression of hOsa2 was induced (+) the following day by removal of Dox. The cells were harvested and luciferase activity measured after 24 h. (B) Saos-2 cells were transiently transfected with p21 promoter-reporter plasmid (0.1 µg), a plasmid expressing T7-hOsa2(16e) (1.5 and 1 µg) or a plasmid expressing T7-p53 (1, 0.5 and 0.1 µg) using the Lipofectamine™ Plus reagent. The cells were then harvested and luciferase activity measured after 24 h. The experiment was performed in triplicate (lanes 1–3) and in duplicate (lanes 4–6) and the average or the spread of the mean is shown. An immunoblot of the transfected cell lysates with anti-T7 antibody is shown in the right-hand panel.
Figure 7
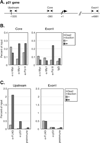
Figure 7. ChIP analysis of the p21 core promoter and the upstream region
(A) The p21 gene indicating the transcriptional start site (+1) and upstream, core and exon1 regions amplified by PCR in ChIP assays. A p53-binding site is shown as a box in the upstream region; a box near the start site represents a reported binding site for Miz-1. (B) 16eC3 cells uninduced (−) or induced for 24 h (+) were cross-linked with formaldehyde and ChIP assays of the p21 core promoter region and exon1 were performed using the indicated antibodies. The products were amplified with primers specific to the core promoter region of the p21 gene, as well as p21 exon1 as a control, and plotted as a percentage of input. IgG, normal mouse IgG. (C) ChIP assays of the p21 upstream region containing p53-binding sites and exon1 as a control. anti-FLAG ChIP was performed with antibody-conjugated agarose beads (EZview beads, Sigma). Preimmune, rabbit serum.
Figure 8
Figure 8. Knockdown of Miz-1 but not p53 affects p21 gene expression in 16e cells
16eC3 cells transfected with the indicated siRNA were induced for 7 h and then the cell lysates were analysed by immunoblotting with antibodies against proteins indicated to the right of the gel. *NS, Non-specific cross-reacting protein.
Figure 9
Figure 9. hOsa2 represses c-myc and activates p21 gene transcription
The transcriptional regulatory region of the c-myc and the p21 gene before and after the induction of hOsa2. In uninduced cells, the p21 promoter region is bound by c-Myc, which represses activation by Miz-1. Increased expression of hOsa2 represses c-myc gene expression, permitting Miz-1 to activate the p21 gene. hOsa2 also binds to the upstream regulatory region of the p21 gene and increases promoter activity through a p53-independent mechanism.

Similar articles

Cited by

References

    1. Sif S. ATP-dependent nucleosome remodeling complexes: enzymes tailored to deal with chromatin. J. Cell. Biochem. 2004;91:1087–1098. - PubMed
    1. Lusser A, Kadonaga JT. Chromatin remodeling by ATP-dependent molecular machines. BioEssays. 2003;25:1192–1200. - PubMed
    1. de la Serna IL, Ohkawa Y, Imbalzano AN. Chromatin remodelling in mammalian differentiation: lessons from ATP-dependent remodellers. Nat. Rev. Genet. 2006;7:461–473. - PubMed
    1. Saha A, Wittmeyer J, Cairns BR. Chromatin remodelling: the industrial revolution of DNA around histones. Nat. Rev. Mol. Cell Biol. 2006;7:437–447. - PubMed
    1. Mohrmann L, Verrijzer CP. Composition and functional specificity of SWI2/SNF2 class chromatin remodeling complexes. Biochim. Biophys. Acta. 2005;1681:59–73. - PubMed

Publication types

MeSH terms

Substances