. 2011 Apr;18(4):732-42.
doi: 10.1038/cdd.2010.147. Epub 2010 Nov 26.

Tunneling-nanotube development in astrocytes depends on p53 activation

Affiliations

Tunneling-nanotube development in astrocytes depends on p53 activation

Y Wang et al. Cell Death Differ. 2011 Apr.

Abstract

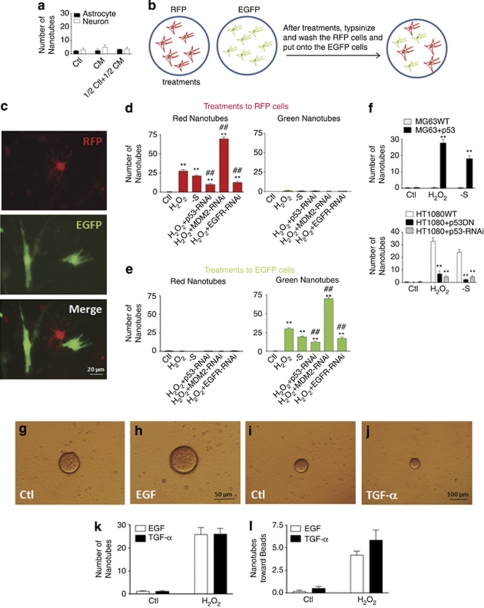
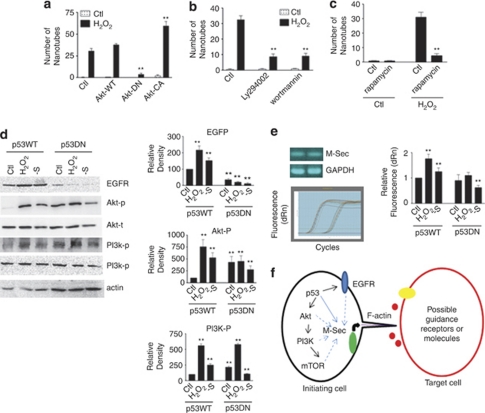
Tunneling nanotubes (TNTs) can be induced in rat hippocampal astrocytes and neurons with H(2)O(2) or serum depletion. Major cytoskeletal component of TNTs is F-actin. TNTs transfer endoplasmic reticulum, mitochondria, Golgi, endosome and intracellular as well as extracellular amyloid β. TNT development is a property of cells under stress. When two populations of cells are co-cultured, it is the stressed cells that always develop TNTs toward the unstressed cells. p53 is crucial for TNT development. When p53 function is deleted by either dominant negative construct or siRNAs, TNT development is inhibited. In addition, we find that among the genes activated by p53, epidermal growth factor receptor is also important to TNT development. Akt, phosphoinositide 3-kinase and mTOR are involved in TNT induction. Our data suggest that TNTs might be a mechanism for cells to respond to harmful signals and transfer cellular substances or energy to another cell under stress.


Figures

Figure 1
Figure 1
TNTs are induced by H2O2 or serum deprivation in rat astrocytes and neurons. (a) Rat hippocampal astrocytes were microinjected with Alexa488 dye and a TNT (arrow) developed at 24 h after H2O2 treatment. The arrow indicates a TNT. (b) Phase contrast picture of a. The arrow indicates a TNT. (c) In the cells microinjected with Alexa488 at 24 h after H2O2 treatment, TNTs could be induced between astrocytes as well as between neurons and astrocytes. The arrows indicate TNTs. Scale bar for ac: 20 μm. (d) Neurons developed a TNT (arrow) after serum depletion for 7 days. Scale bar: 50 μm. (d1) High-magnification picture of d. Scale bar: 20 μm. (e) HEK293 cells under control condition. (f) HEK293 cells developed TNTs (arrows) after serum depletion for 7 days. Scale bar for e and f: 20 μm. (g) Quantification of TNT induction by H2O2 and serum depletion in astrocytes and neurons. Number of TNTs were counted in 100 cells in three independent preparations (n=3). Data represented mean±S.E., **P<0.01 compared with control groups. (h) Quantification of TNT induction by H2O2 and serum depletion in HEK293 cells (n=3). Data represented mean±S.E., **P<0.01 compared with control groups. (i) Top left panel: a TNT (arrow) was taken X–Z scanning (framed area). Top right panel: X–Z section showed that the TNT did not attach to the bottom culture surface. Bottom panel: the relative density was calculated at the scanning plate 1, 20, 40 for Z axis and 1, 8, 16 for X axis. Scale bar: 50 μm. (j) Distributions of TNT length (n=100). (k) Gap junction inhibitor CBX (1 and 10 mM) did not inhibit TNT development in astrocytes and neurons (n=3). Data represented mean±S.E., **P<0.01 compared with control groups. (l) Astrocytes infected with Organelle Light Intracellular Targeted Fluorescent Proteins actin-GFP developed TNTs (arrows). (m) Neurons and astrocytes infected with Organelle Light Intracellular Targeted Fluorescent Proteins actin-GFP developed TNTs between astrocytes (arrow) and between neurons and astrocytes (arrow head). Scale bar for l and m: 20 μm. (n) F-actin-disrupting agent latrunculin A or cytochalasin D blocked TNT induction in neurons (left panel) and astrocytes (right panel), whereas microtubule-disrupting agent nocodazole or microtubule-stabilizing agent paclitaxel did not alter TNT induction (n=3). Data represented mean±S.E., **P<0.01 compared with control groups. (o) Astrocytes infected with Organelle Light Intracellular Targeted Fluorescent Proteins plasma membrane (PM)-GFP developed TNTs. Scale bar: 20 μm. (o1) High-magnification picture of o. Scale bar: 5 μm. (p) A TNT (arrow) transferred materials from an astrocyte injected with Alexa488 to the target cell (arrow head) at time 0. (q) A TNT (arrow) transferred materials from an astrocyte injected with Alexa488 to the target cell (arrow head) at time 10 min. Scale bar for p and q: 20 μm
Figure 2
Figure 2
TNTs transfer ER, Golgi, endosome and mitochondria. (a) Astrocytes injected with Alexa488 developed TNTs at time 0. (b) The same cell in a at the time of 10 min. Scale bar for a and b: 20 μm. (a1) High-magnification picture of a TNT in a. (b1) The same spot in a1 (arrow) moved upward at the time of 10 min. (a2) High-magnification picture of a TNT in a. (b2) The same spot in a2 (arrow) moved upward at the time of 10 min. Scale bar for a1b2: 2 μm. (c) Astrocytes infected with Organelle Light Intracellular Targeted Fluorescent Proteins ER-GFP developed TNTs. Scale bar: 50 μm. (c1) High-magnification picture of c. Arrows: TNTs. Scale bar: 25 μm. (d) Astrocytes infected with Organelle Light Intracellular Targeted Fluorescent Proteins Golgi-RFP developed TNTs. Scale bar: 50 μm. (d1) High-magnification picture of d Arrows: TNTs. Scale bar: 25 μm. (e) Astrocytes infected with Organelle Light Intracellular Targeted Fluorescent Proteins endosome-GFP developed TNTs. Scale bar: 50 μm. (e1) High-magnification picture of e. Arrows: TNTs. Scale bar: 25 μm. (f) Astrocytes infected with Organelle Light Intracellular Targeted Fluorescent Proteins mitochondria (mito)-RFP developed TNTs. Scale bar: 50 μm. (f1) High-magnification picture of f. Arrows: TNTs. Scale bar: 25 μm. (g) Top panels or left panel: particle movement velocities changed with time for ER, Golgi, endosome and mitochondria measured by movement of Organelle Light Intracellular Targeted Fluorescent Proteins markers in TNTs. Data represented mean±S.E. Bottom panels or right panel: particle movement distances changed with time for ER, Golgi, endosome and mitochondria measured by movement of Organelle Light Intracellular Targeted Fluorescent Proteins markers in TNTs. Data represented mean±S.E.
Figure 3
Figure 3
Aβ can be transferred by TNTs and induced cytotoxicity. (a) Intracellularly expressed fusion protein Aβ-EGFP was transfected into astrocytes at time 0. (b) EGFP transferred from one astrocytes to another ones at the time of 30 min. Arrows: TNTs. (c) Intracellularly expressed fusion protein Aβ-EGFP was microinjected into neurons at time 0. (d) EGFP transferred from one neurons to another ones at the time of 30 min. Arrows: TNTs. Scale bar for ad: 20 μm. (e) Intracellular Aβ movement velocities and distance changed with time in TNTs in astrocytes and neurons. Data represented mean±S.E. (f) Aβ monomers were transferred by TNTs (arrow). (g) Protofibrils of Aβ were transferred by TNTs (arrow). Scale bar for f and g: 20 μm. (h) Top panel: Aβ transferred by TNTs induced significant cell death. Bottom panel: TNTs were induced by H2O2 in both EGFP and Aβ infected groups. Data represented mean±S.E. **P<0.01 compared with control groups
Figure 4
Figure 4
TNT development is p53 dependent. (a) Neurons in culture under the control conditions. (b) Heparin-coated acrylic beads were added to cell culture. (c) Heparin-coated acrylic beads soaked with NGF were added to cell culture. Scale bar for ac: 100 μm. (d) Neurons in culture under the control conditions. (e) Neurons in culture after scratching. Scale bar for d and e: 50 μm. (f) Quantification of TNT induction with NGF-containing beads added in neurons and astrocytes (n=3). Data represented mean±S.E. (g) Quantification of TNT induction with scratching in neurons and astrocytes (n=3). Data represented mean±S.E. (h) Astrocytes transfected with EGFP were treated in control medium. (i) Astrocytes transfected with EGFP were treated in H2O2 for 24 h. (j) Astrocytes transfected with EGFP and wild-type p53 were treated in H2O2 for 24 h. (k) Astrocytes transfected with EGFP and dominant negative mutant p53 were treated in H2O2 for 24 h. (l) Astrocytes transfected with EGFP and siRNA to MDM2 were treated in H2O2 for 24 h. (m) Astrocytes transfected with EGFP and siRNA to EGFR were treated in H2O2 for 24 h. Scale bar for hm: 20 μm. (h1) High-magnification picture of h. (i1) High-magnification picture of i. (j1) High-magnification picture of j. (k1) High-magnification picture of k. (l1) High-magnification picture of l. (m1) High-magnification picture of m. Scale bar for h1–m1: 5 μm. (n) p53 dominant negative mutant blocked TNT induction in astrocytes (n=3). Data represented mean±S.E., **P<0.01 compared with control groups. (o) p53 dominant negative mutant blocked TNT induction in neurons (n=3). Data represented mean±S.E., **P<0.01 compared with control groups. (p) Effects of siRNAs to p53, MDM2 and EGFR on TNT induction (n=3). Data represented mean±S.E., **P<0.01 compared with control groups
Figure 5
Figure 5
TNT development is a property of stressed cells. (a) Conditioned medium from serum depletion (7 days) cells was supplemented by serum and added to second batch of cells (n=3). Data represented mean±S.E. (b) Experiment procedure for co-culture of RFP and EGFP-expressing astrocytes. (c) Co-cultured cells were pictured at red (top panel), green (middle panel) and merged (bottom panel) filters. Scale bar: 20 μm. (d) When stress was applied to red cells, TNTs developed from red cells toward green cells (left panel), not from green cells to red cells (right panel) (n=3). Data represented mean±S.E, **P<0.01 compared with control groups, ##P<0.01 compared with H2O2 group. (e) When stress was applied to green cells, TNTs developed from green cells toward red cells (right panel), not from red cells to green cells (left panel) (n=3). Data represented mean±S.E., **P<0.01 compared with control groups, ##P<0.01 compared with H2O2 group. (f) TNT induction in MG63 (top panel) and HT1080 (bottom panel) cells (n=3). Data represented mean±S.E., **P<0.01 compared with control groups. (g) Astrocytes in culture under the control conditions. (h) Heparin-coated acrylic beads soaked with EGF were added to cell culture. Scale bar for g and h 50 μm. (i) Astrocytes in culture under the control conditions. (j) Heparin-coated acrylic beads soaked with TGF-α were added to cell culture. Scale bar for i and j: 100 μm. (k) Quantification of TNT induction with EGF-containing beads added in astrocytes (n=3). Data represented mean±S.E. (l) Quantification of TNT induction with TGF-α-containing beads added in astrocytes (n=3). Data represented mean±S.E.
Figure 6
Figure 6
Akt, PI3K and mTOR are involved in TNT development. (a) TNT induction in astrocytes transfected with wild-type Akt, dominant negative Akt and constitutively active Akt (n=3). Data represented mean±S.E., **P<0.01 compared with control groups. (b) TNT induction with treatments of PI3K inhibitors ly294002 and wortmannin (n=3). Data represented mean±S.E., **P<0.01 compared with control groups. (c) TNT induction with treatment of mTOR inhibitor rapamycin (n=3). Data represented mean±S.E., **P<0.01 compared with control groups. (d) Western blots showing the levels of EGFR, phosphorylated Akt, total Akt, phosphorylated PI3K, total PI3K and actin (n=3). Data represented mean±S.E., **P<0.01 compared with control groups. (e) Top left panel: the expression of M-Sec was confirmed by RT-PCR in rat hippocampal astrocytes. Bottom left panel: Fluorescence recorded from real-time PCR (45 cycles). Right panel: quantification of real-time RT-PCR suggested that M-Sec increased with p53 activation (n=3). Data represented mean±S.E., **P<0.01 compared with control groups. (f) Schematic drawing of TNT induction pathways

Similar articles

Cited by

References

    1. Rustom A, Saffrich R, Markovic I, Walther P, Gerdes HH. Nanotubular highways for intercellular organelle transport. Science. 2004;303:1007–1010. - PubMed
    1. Onfelt B, Davis DM. Can membrane nanotubes facilitate communication between immune cells. Biochem Soc Trans. 2004;32 (Part 5:676–678. - PubMed
    1. Onfelt B, Nedvetzki S, Yanagi K, Davis DM. Cutting edge: membrane nanotubes connect immune cells. J Immunol. 2004;173:1511–1513. - PubMed
    1. Vidulescu C, Clejan S, O'Connor KC. Vesicle traffic through intercellular bridges in DU 145 human prostate cancer cells. J Cell Mol Med. 2004;8:388–396. - PMC - PubMed
    1. Watkins SC, Salter RD. Functional connectivity between immune cells mediated by tunneling nanotubules. Immunity. 2005;23:309–318. - PubMed

Publication types

MeSH terms