High-resolution genome-wide in vivo footprinting of diverse transcription factors in human cells
- PMID: 21106903
- PMCID: PMC3044859
- DOI: 10.1101/gr.112656.110
High-resolution genome-wide in vivo footprinting of diverse transcription factors in human cells
Abstract
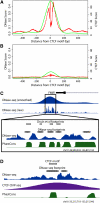
Regulation of gene transcription in diverse cell types is determined largely by varied sets of cis-elements where transcription factors bind. Here we demonstrate that data from a single high-throughput DNase I hypersensitivity assay can delineate hundreds of thousands of base-pair resolution in vivo footprints in human cells that precisely mark individual transcription factor-DNA interactions. These annotations provide a unique resource for the investigation of cis-regulatory elements. We find that footprints for specific transcription factors correlate with ChIP-seq enrichment and can accurately identify functional versus nonfunctional transcription factor motifs. We also find that footprints reveal a unique evolutionary conservation pattern that differentiates functional footprinted bases from surrounding DNA. Finally, detailed analysis of CTCF footprints suggests multiple modes of binding and a novel DNA binding motif upstream of the primary binding site.
Figures


Similar articles
-
An expansive human regulatory lexicon encoded in transcription factor footprints.Nature. 2012 Sep 6;489(7414):83-90. doi: 10.1038/nature11212. Nature. 2012. PMID: 22955618 Free PMC article.
-
High-resolution mapping of in vivo genomic transcription factor binding sites using in situ DNase I footprinting and ChIP-seq.DNA Res. 2013 Aug;20(4):325-38. doi: 10.1093/dnares/dst013. Epub 2013 Apr 11. DNA Res. 2013. PMID: 23580539 Free PMC article.
-
Explicit DNase sequence bias modeling enables high-resolution transcription factor footprint detection.Nucleic Acids Res. 2014 Oct 29;42(19):11865-78. doi: 10.1093/nar/gku810. Epub 2014 Oct 7. Nucleic Acids Res. 2014. PMID: 25294828 Free PMC article.
-
Protein-DNA binding in high-resolution.Crit Rev Biochem Mol Biol. 2015;50(4):269-83. doi: 10.3109/10409238.2015.1051505. Epub 2015 Jun 3. Crit Rev Biochem Mol Biol. 2015. PMID: 26038153 Free PMC article. Review.
-
Genome-wide quantification of transcription factor binding at single-DNA-molecule resolution using methyl-transferase footprinting.Nat Protoc. 2021 Dec;16(12):5673-5706. doi: 10.1038/s41596-021-00630-1. Epub 2021 Nov 12. Nat Protoc. 2021. PMID: 34773120 Free PMC article. Review.
Cited by
-
Transcriptional activation by the thyroid hormone receptor through ligand-dependent receptor recruitment and chromatin remodelling.Nat Commun. 2015 Apr 28;6:7048. doi: 10.1038/ncomms8048. Nat Commun. 2015. PMID: 25916672 Free PMC article.
-
Sequence and chromatin determinants of cell-type-specific transcription factor binding.Genome Res. 2012 Sep;22(9):1723-34. doi: 10.1101/gr.127712.111. Genome Res. 2012. PMID: 22955984 Free PMC article.
-
Identifying novel transcriptional components controlling energy metabolism.Cell Metab. 2011 Dec 7;14(6):739-45. doi: 10.1016/j.cmet.2011.11.007. Cell Metab. 2011. PMID: 22152302 Free PMC article. Review.
-
Comprehensive genome-wide protein-DNA interactions detected at single-nucleotide resolution.Cell. 2011 Dec 9;147(6):1408-19. doi: 10.1016/j.cell.2011.11.013. Cell. 2011. PMID: 22153082 Free PMC article.
-
Identification of transcription factor co-binding patterns with non-negative matrix factorization.Nucleic Acids Res. 2024 Oct 14;52(18):e85. doi: 10.1093/nar/gkae743. Nucleic Acids Res. 2024. PMID: 39217462 Free PMC article.
References
-
- Boffelli D, McAuliffe J, Ovcharenko D, Lewis KD, Ovcharenko I, Pachter L, Rubin EM 2003. Phylogenetic shadowing of primate sequences to find functional regions of the human genome. Science 299: 1391–1394 - PubMed
Publication types
MeSH terms
Substances
Associated data
- Actions
- Actions
Grants and funding
LinkOut - more resources
Full Text Sources
Other Literature Sources
Molecular Biology Databases
