

Implication of Kir4.1 channel in excess potassium clearance: an in vivo study on anesthetized glial-conditional Kir4.1 knock-out mice
- PMID: 21106816
- PMCID: PMC6633770
- DOI: 10.1523/JNEUROSCI.2078-10.2010
Implication of Kir4.1 channel in excess potassium clearance: an in vivo study on anesthetized glial-conditional Kir4.1 knock-out mice
Abstract
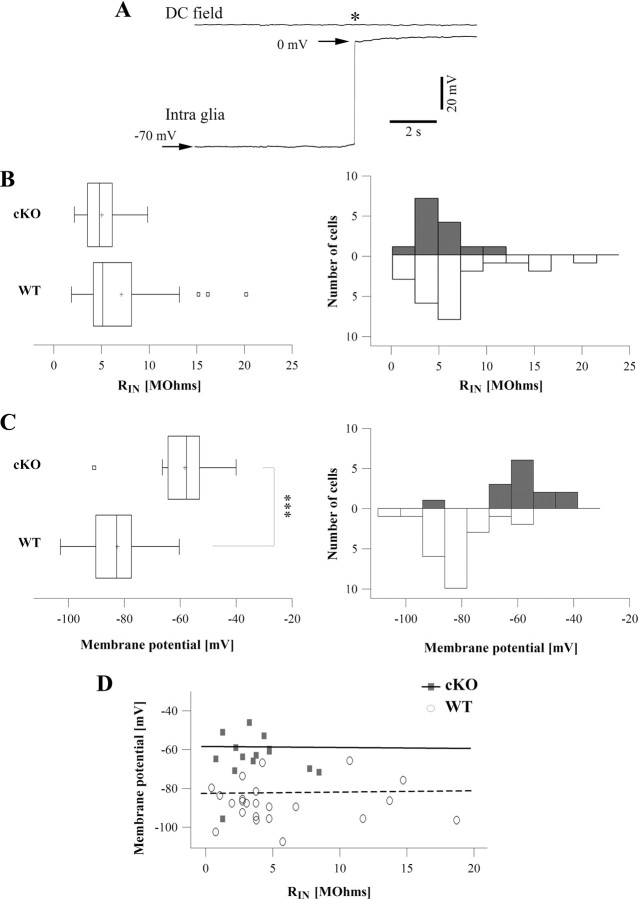
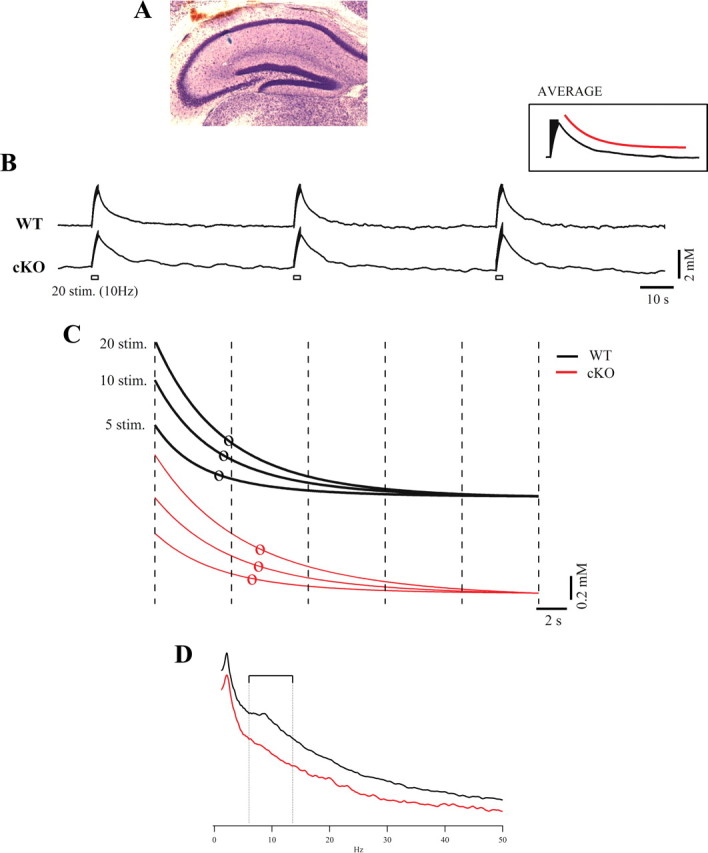
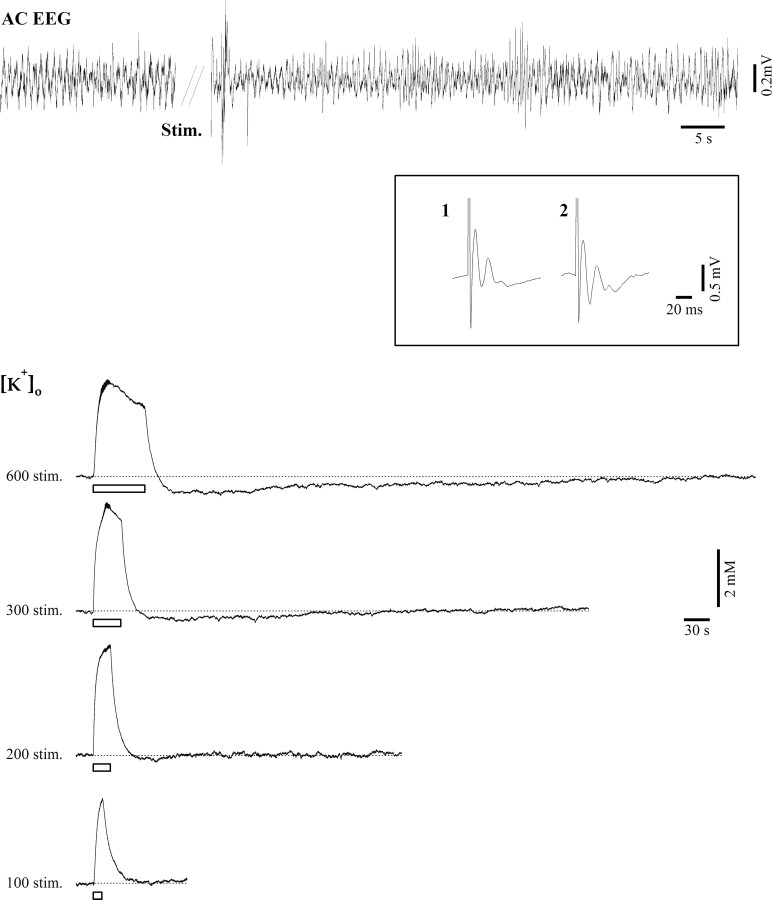
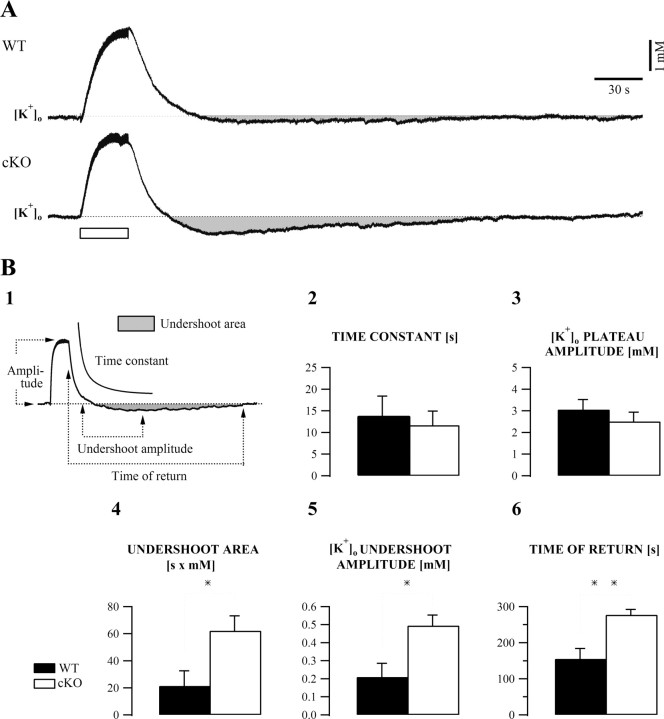
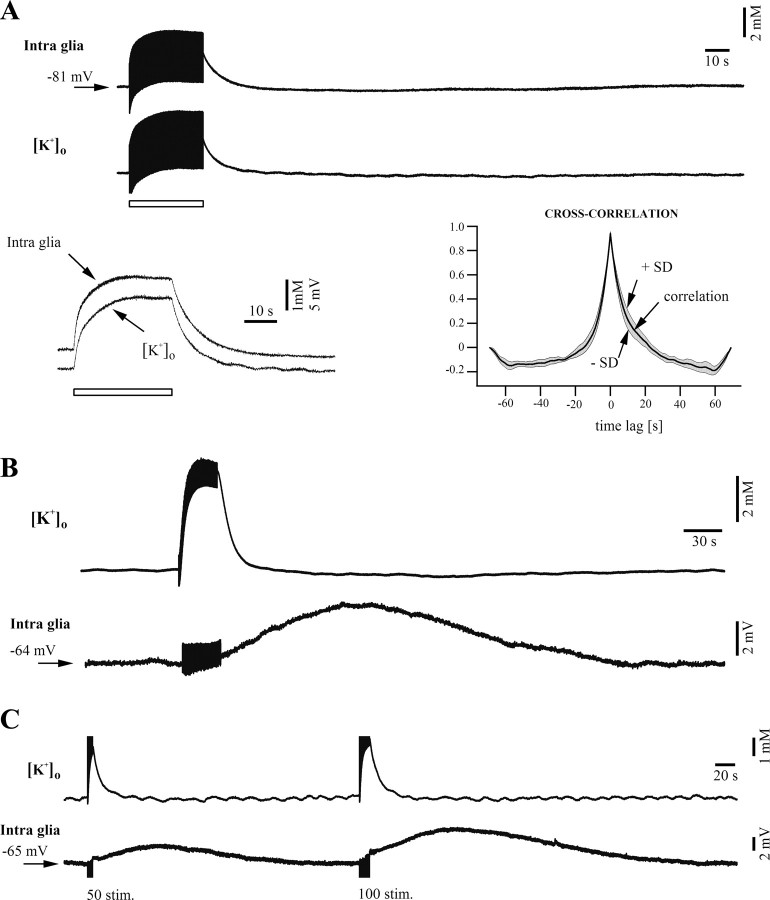
The K(ir)4.1 channel is crucial for the maintenance of the resting membrane potential of glial cells, and it is believed to play a main role in the homeostasis of extracellular potassium. To understand its importance in these two phenomena, we have measured in vivo the variations of extracellular potassium concentration ([K(+)](o)) (with potassium-sensitive microelectrodes) and membrane potential of glial cells (with sharp electrodes) during stimulations in wild-type (WT) mice and glial-conditional knock-out (cKO) K(ir)4.1 mice. The conditional knockout was driven by the human glial fibrillary acidic protein promoter, gfa2. Experiments were performed in the hippocampus of anesthetized mice (postnatal days 17-24). Low level stimulation (<20 stimuli, 10 Hz) induced a moderated increase of [K(+)](o) (<2 mm increase) in both WT and cKO mice. However, cKO mice exhibited slower recovery of [K(+)](o) levels. With long-lasting stimulation (300 stimuli, 10 Hz), [K(+)](o) in WT and cKO mice displayed characteristic ceiling level (>2 mm increase) and recovery undershoot, with a more pronounced and prolonged undershoot in cKO mice. In addition, cKO glial cells were more depolarized, and, in contrast to those from WT mice, their membrane potential did not follow the stimulation-induced [K(+)](o) changes, reflecting the loss of their high potassium permeability. Our in vivo results support the role of K(ir)4.1 in setting the membrane potential of glial cells and its contribution to the glial potassium permeability. In addition, our data confirm the necessity of the K(ir)4.1 channel for an efficient uptake of K(+) by glial cells.
Figures
Similar articles
-
Conditional knock-out of Kir4.1 leads to glial membrane depolarization, inhibition of potassium and glutamate uptake, and enhanced short-term synaptic potentiation.J Neurosci. 2007 Oct 17;27(42):11354-65. doi: 10.1523/JNEUROSCI.0723-07.2007. J Neurosci. 2007. PMID: 17942730 Free PMC article.
-
Relationship between glial potassium regulation and axon excitability: a role for glial Kir4.1 channels.Glia. 2012 Apr;60(4):651-60. doi: 10.1002/glia.22299. Epub 2012 Jan 30. Glia. 2012. PMID: 22290828
-
Aquaporin-4 independent Kir4.1 K+ channel function in brain glial cells.Mol Cell Neurosci. 2008 Jan;37(1):1-10. doi: 10.1016/j.mcn.2007.08.007. Epub 2007 Aug 15. Mol Cell Neurosci. 2008. PMID: 17869537 Free PMC article.
-
Inwardly rectifying potassium channels (Kir) in central nervous system glia: a special role for Kir4.1 in glial functions.J Cell Mol Med. 2006 Jan-Mar;10(1):33-44. doi: 10.1111/j.1582-4934.2006.tb00289.x. J Cell Mol Med. 2006. PMID: 16563220 Free PMC article. Review.
-
Functional implications for Kir4.1 channels in glial biology: from K+ buffering to cell differentiation.J Neurochem. 2008 Nov;107(3):589-601. doi: 10.1111/j.1471-4159.2008.05615.x. Epub 2008 Aug 8. J Neurochem. 2008. PMID: 18691387 Free PMC article. Review.
Cited by
-
Sonic hedgehog signaling in astrocytes.Cell Mol Life Sci. 2021 Feb;78(4):1393-1403. doi: 10.1007/s00018-020-03668-8. Epub 2020 Oct 20. Cell Mol Life Sci. 2021. PMID: 33079226 Free PMC article. Review.
-
Oligodendrocyte-encoded Kir4.1 function is required for axonal integrity.Elife. 2018 Sep 11;7:e36428. doi: 10.7554/eLife.36428. Elife. 2018. PMID: 30204081 Free PMC article.
-
Astrocytic glycogenolysis: mechanisms and functions.Metab Brain Dis. 2015 Feb;30(1):317-33. doi: 10.1007/s11011-014-9536-1. Epub 2014 Apr 18. Metab Brain Dis. 2015. PMID: 24744118 Review.
-
The role of glial-specific Kir4.1 in normal and pathological states of the CNS.Acta Neuropathol. 2016 Jul;132(1):1-21. doi: 10.1007/s00401-016-1553-1. Epub 2016 Mar 9. Acta Neuropathol. 2016. PMID: 26961251 Free PMC article. Review.
-
Hyperglycemia reduces functional expression of astrocytic Kir4.1 channels and glial glutamate uptake.Neuroscience. 2015 Dec 3;310:216-23. doi: 10.1016/j.neuroscience.2015.09.044. Epub 2015 Sep 25. Neuroscience. 2015. PMID: 26404875 Free PMC article.
References
-
- Ammann D. Ion-selective microelectrodes: principles, design and application. Berlin: Springer; 1986.
-
- Bendat J, Piersol A. Engineering applications of correlation and spectral analysis. New York: Wiley; 1980.
Publication types
MeSH terms
Substances
Grants and funding
LinkOut - more resources
Full Text Sources
Medical
Molecular Biology Databases