. 2011 Feb;85(4):1732-46.
doi: 10.1128/JVI.01713-10. Epub 2010 Nov 24.

The activator protein 1 binding motifs within the human cytomegalovirus major immediate-early enhancer are functionally redundant and act in a cooperative manner with the NF-{kappa}B sites during acute infection

Affiliations

The activator protein 1 binding motifs within the human cytomegalovirus major immediate-early enhancer are functionally redundant and act in a cooperative manner with the NF-{kappa}B sites during acute infection

Elena Isern et al. J Virol. 2011 Feb.

Abstract

Human cytomegalovirus (HCMV) infection causes a rapid induction of c-Fos and c-Jun, the major subunits of activator protein 1 (AP-1), which in turn have been postulated to activate the viral immediate-early (IE) genes. Accordingly, the major IE promoter (MIEP) enhancer, a critical control region for initiating lytic HCMV infection and reactivation from the latent state, contains one well-characterized AP-1 site and a second candidate interaction site. In this study we explored the role of these AP-1 elements in the context of the infection. We first show that the distal candidate AP-1 motif binds c-Fos/c-Jun heterodimers (AP-1 complex) and confers c-Fos/c-Jun-mediated activity to a core promoter. Site-directed mutagenesis studies indicate that both AP-1 response elements are critical for 12-O-tetradecanoylphorbol-13-acetate (TPA)-enhanced MIEP activity in transient-transfection assays. In marked contrast to the results obtained with the isolated promoter, disruption of the AP-1 recognition sites of the MIEP in the context of the infectious HCMV genome has no significant influence on the expression of the MIE protein IE1 or viral replication in different cell types. Moreover, a chimeric murine CMV driven by the HCMV MIEP (hMCMV-ES) with the two AP-1 binding sites mutated is not compromised in virulence, is able to grow and disseminate to different organs of the newborn mice as efficiently as the parental virus, and is competent in reactivation. We show, however, that combined inactivation of the enhancer AP-1 and NF-κB recognition sites leads to an attenuation of the hMCMV-ES in the neonatal murine infection model, not observed when each single element is abolished. Altogether, these results underline the functional redundancy of the MIEP elements, highlighting the plasticity of this region, which probably evolved to ensure maximal transcriptional performance across many diverse environments.


Figures

FIG. 1.
FIG. 1.
The AP-1−239 motif of the HCMV MIEP binds c-Jun/c-Fos heterodimers and confers c-Jun/c-Fos-mediated responsiveness. (A) Mobility shift assay demonstrating the interaction of c-Jun/c-Fos heterodimers with the AP-1−239 motif of the HCMV MIEP. All lanes contained the radiolabeled probe with the MIEP AP-1−239 site (MIEP-239; a) or with a consensus AP-1 motif (AP-1cons; b) and in vitro-translated c-Fos, c-Jun, or cotranslational AP-1 complex (co-Fos/Jun), except lane 1, which contained rabbit reticulocyte lysate as a control, as indicated. In addition, a 10-fold molar excess of unlabeled AP-1cons probe (b, lane 7), MIEP-239 probe (a, lane 8), a probe containing MIEP−174 (c, lane 9), or a nonspecific probe containing the NF-κB site (d, lane 10) was included. The positions of the major specific nucleoprotein complexes (NPC) corresponding to the c-Fos/c-Jun complex and of the free probe (P) are indicated. The nucleotide sequences of MIEP-239 and AP-1cons probes, with the corresponding AP-1 motifs in boxes, are shown at the bottom of the autoradiograph. (B) The AP-1−239 element of the HCMV MIEP confers c-Fos/c-Jun-mediated responsiveness. A scheme of the reporter constructs pMIEP(−66/+7)CAT and pMIEP(−66/+7)2Ap1CAT is shown, with the CAT gene represented by a shaded box, the location of the two copies of the AP-1−239 motif inserted at the −66 site of the MIEP marked by a black box, and their orientation indicated by arrows. Coordinates are given with respect to the HCMV ie1/ie2 transcriptional start site (+1). U373 cells were cotransfected with pMIEP(−66/+7)CAT or pMIEP(−66/+7)2Ap1CAT, along with a c-Jun, a c-Fos, or both c-Jun and c-Fos expression vectors, and 36 h later CAT activity present in the extracts was determined. Transfection efficiency was standardized by cotransfection of pRSV-β-Gal. The fold stimulation of CAT activity, calculated for each construct by taking as 1.00 the activity of the reporter gene in the absence of c-Fos and c-Jun, is shown. Data derived from a representative CAT assay (from three independent experiments) are presented.
FIG. 2.
FIG. 2.
Effect of the elimination of the two enhancer AP-1 sites on MIEP activity. (A) The nucleotide sequences and locations of the two AP-1 sites lying within the MIEP enhancer are shown in shaded boxes. Below the wild-type sequence, the specific point mutations introduced in each AP-1 element are indicated in lowercase letters. Coordinates refer to the HCMV ie1/ie2 transcriptional start site. (B) Structures of the luciferase (Luc) reporter plasmids containing MIEP sequences from −1144 to +112 without (pMIEP.Luc) or with the AP-1−239 site (pMIEPAp1−239.Luc), the AP-1−239 and AP-1−174 sites (pMIEPAp1−239/−174.Luc), or the NF-κB sites (pMIEPNFkB.Luc) altered. AP-1 and NF-κB recognition sites are marked by circles and rectangles, respectively, and their positions within the MIEP are indicated. Open symbols, wild-type sequence; black symbols, mutated sequences. (C) U937 cells were electroporated with the indicated luciferase reporter constructs along with the internal control plasmid pRL-TK. Fifteen hours later, cells were serum starved for 24 h and then treated with TPA (20 ng/ml; +) or vehicle (DMSO; −) for 6 h. Cells were lysed, and luciferase activity was determined. Each value represents the average ± standard deviation of four determinations. The results are presented as the fold induction, taking as 1.00 the activity exhibited by the cells transfected with plasmid pMIEP.Luc in the absence of TPA. (D) Similar to the experiment shown in panel C, except that the results are presented as percentages of TPA stimulation of cells transfected with the corresponding reporter construct relative to the activity of TPA-induced cells transfected with pMIEP.Luc (100%). (E) MEFs were transfected with pMIEP.Luc, pMIEPAp1−239/−174.Luc, or pMIEPNFkB.Luc and processed as indicated for panel D. Fold induction of the pMIEP.Luc after TPA stimulation ranged from 4 to 9 in different experiments carried out in MEFs.
FIG. 3.
FIG. 3.
Construction of HCMV mutants with the AP-1 sites in the MIEP enhancer disrupted. (A) Schematic representation of the HCMV-BAC genomes generated. The top line represents the EcoRI map of the parental HCMV-BAC genome, with the BAC region and the E-GFP gene indicated by a gray box. The EcoRI J fragment encompassing the HCMV MIE region is enlarged below, with the structures of the ie1 and ie2 transcripts indicated. Coding and noncoding exons are depicted as black and white boxes, respectively. The crosshatched bar in line 1 represents the MIEP enhancer (nucleotides −52 to −667 relative to the ie1/ie2 transcription start site) of the parental HCMV genome, with the AP-1 sites indicated in white. Line 2 represents the MIEP enhancer of the HCMV.Ap1-BAC genomes with the AP-1 sites disrupted indicated in black. The BglII restriction site introduced when mutating the MIEP AP-1 site at −239 is shown. Primers dN and dBlp, used to amplify the enhancer region, are marked. The sizes of the PCR-amplified products from the HCMV or the HCMV.Ap1 genomes after digestion with BglII are indicated below lines 1 and 2, respectively. The illustration is not drawn to scale. (B) Ethidium bromide-stained agarose gel of EcoRI-digested parental HCMV, HCMV.Ap1a, and HCMV.Ap1b genomes after separation on a 0.6% agarose gel. Size markers are shown at the left. (C) Verification of the appropriate mutagenesis of the AP-1 recognition sites within the HCMV MIEP. The enhancer sequences from the parental HCMV and mutant HCMV.Ap1 viruses were PCR amplified using the dN and dBlp primers. Shown are the amplified products separated on a 2% agarose gel before and after treatment with BglII. Size markers are shown at the left, and product sizes are shown at the right.
FIG. 4.
FIG. 4.
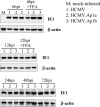
Analysis of IE1 expression in HCMV.Ap1-infected cells. HEL299 fibroblasts were mock infected or infected at an MOI of 0.6 (for the 6- and 12-h-p.i. time points) or 0.1 (for the 24-, 48-, and 72-h-p.i. time points) with HCMV, HCMV.Ap1a, and HCMV.Ap1b. When indicated, cells were treated with TPA. At designated times p.i., cells were lysed and subjected to Western blot analysis with an HCMV IE1-specific antibody. Anti-β-actin antibody was used as an internal control.
FIG. 5.
FIG. 5.
Growth kinetics of HCMV.Ap1 mutants in different cell types. (A) Cells were infected at an MOI of 0.025 (HEL299) or 1 (U373 and RPE) with HCMV, HCMV.Ap1a, and HCMV.Ap1b. At the indicated days p.i. cultures were collected and the amounts of extracellular (HEL299 and RPE) or cell-associated (U373) infectious virus present were determined. Each data point represents the average and standard deviation of three separate cultures. Dashed lines represent the limits of detection. (B) Similar to the experiment shown in panel A, except that HEL299 cells were serum starved as indicated in Materials and Methods. (C) Similar to the experiment shown in panel B, except that HEL299 cells were treated with TPA.
FIG. 6.
FIG. 6.
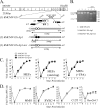
Construction and in vitro growth analysis of parental hMCMV-ES, hMCMV-ES.Ap1, and hMCMV-ES.Ap1-rev viruses. (A) Schematic illustrations of the parental hMCMV-ES, hMCMV-ES.Ap1, and hMCMV-ES.Ap1-rev genomes. The HindIII map of the parental MCMV genome is given at the top with the BAC sequences represented by a gray box. The enlarged map below (line 1) represents the MIE locus of the hMCMV-ES genome, carrying a 616-bp fragment (shaded rectangle) corresponding to the HCMV MIEP enhancer replacing the MCMV enhancer, with the structure of the MIE transcripts (ie1, ie2, and ie3). Coding and noncoding exons are depicted as black and white boxes, respectively. AP-1 sites are indicated in white. In hMCMV-ES.Ap1 (line 2), the AP-1 binding sites within the enhancer were mutated (black circles). A unique ApaI restriction site, introduced when the MIEP AP-1−174 recognition site was altered, is indicated. In hMCMV-ES.Ap1-rev (line 3), the native HCMV enhancer sequences were reintroduced in hMCMV-ES.Ap1 in replacement of the mutated HCMV enhancer. The sizes of the expected PCR-amplified fragments with primers dN and dBlp (marked by arrows) flanking the MIEP enhancer before and after ApaI treatment are indicated. Coordinates are given relative to the HCMV ie1/ie2 transcription start site. The illustration is not drawn to scale. (B) To verify the appropriate mutagenesis of the AP-1 sites, enhancer sequences were amplified from hMCMV-ES (lanes 1), hMCMV-ES.Ap1 (lanes 2), and hMCMV-ES.Ap1-rev (lanes 3) viruses by PCR using dN and dBlp primers. The amplified products were digested with restriction enzyme ApaI. Shown are the amplified products separated on a 2% agarose gel before and after ApaI treatment. Size markers are shown at the right, and product sizes are shown at the left. (C) Growth kinetics of hMCMV-ES.Ap1 and control viruses in MEFs under different conditions. MEFs were infected at an MOI of 0.025 PFU/cell with hMCMV-ES, hMCMV-ES.Ap1, and hMCMV-ES.Ap1-rev viruses in DMEM-3% FBS, under starvation conditions (DMEM-0.5% FBS), or in the presence of TPA, as indicated. At the designated days p.i., cell supernatants were collected and titrated on MEFs. (D) Replication of hMCMV-ES.Ap1 in different cell types. MMH cells, SVEC-4 cells, and C127I cells were infected at an MOI of 0.025, and RAW 264.7 cells were infected at an MOI of 0.1, with hMCMV-ES and hMCMV-ES.Ap1. The level of infectious virus present in culture supernatants at the designated days p.i. was determined. Each data point represents the average and standard deviation of three separate cultures.
FIG. 7.
FIG. 7.
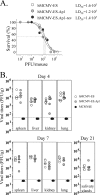
Infection of neonatal BALB/c mice with hMCMV-ES.Ap1, parental, and revertant viruses. (A) Virulence of hMCMV-ES.Ap1 in newborn mice. Groups of 4 to 11 3-day-old BALB/c mice were i.p. inoculated with increasing doses of parental hMCMV-ES, hMCMV-ES.Ap1, and hMCMV-ES.Ap1-rev. Animals were monitored daily for survival, and the corresponding LD50 was calculated as indicated in Materials and Methods. (B) Growth kinetics of hMCMV-ES.Ap1 in the newborn mice. Three-day-old BALB/c mice were i.p. inoculated with 5 × 10⁴ PFU of hMCMV-ES, hMCMV-ES.Ap1, or MCMVdE. Animals were sacrificed at the indicated times after infection, and viral titers from selected organs were determined. Horizontal bars indicate the median values. The dashed lines indicate the limit of detection of the assay. The observed differences did not reach statistical difference (P > 0.05) as determined by the Mann-Whitney test (two-tailed).
FIG. 8.
FIG. 8.
Construction of hMCMV-ES.NFkB/Ap1 and hMCMV-ES.NFkB/Ap1-rev viruses. (A) Schematic illustrations of the parental hMCMV-ES, hMCMV-ES.NFkB, hMCMV-ES.NFkB/Ap1, and hMCMV-ES.NFkB/Ap1-rev genomes. The HindIII map of the parental MCMV genome is given at the top with the BAC sequences represented by a gray box. The enlarged map below (line 1) represents the MIE locus of the hMCMV-ES genome, carrying a 616-bp fragment (shaded rectangle) corresponding to the HCMV MIEP enhancer replacing the MCMV enhancer, with the structure of the MIE transcripts (ie1, ie2, and ie3). Coding and noncoding exons are depicted as black and white boxes, respectively. The AP-1 recognition sites within the enhancer are marked by circles, and the NF-κB ones are shown as rectangles. In hMCMV-ES.NFkB (line 2), the NF-κB binding sites within the enhancer were mutated (black squares), and in hMCMV-ES.NFkB/Ap1 (line 3), both the NF-κB and AP-1 sites were disrupted (black squares and circles, respectively). Unique StuI and ApaI restriction sites, introduced when the MIEP AP-1−174 and NF-κB (at position −101) elements were altered, are indicated. In hMCMV-ES.NFkB/Ap1-rev (line 4), the native HCMV enhancer sequences were reintroduced in hMCMV-ES.NFkB/Ap1 in replacement of the mutated HCMV enhancer. The sizes of the expected PCR-amplified fragments with primers M182 and AA3 (marked by arrows) after StuI and ApaI treatment are indicated. Coordinates are given relative to the HCMV ie1/ie2 transcription start site. The illustration is not drawn to scale. (B) To verify the appropriate mutagenesis of the NF-κB and AP-1 sites, enhancer sequences were amplified from hMCMV-ES (lanes 1), hMCMV-ES.NFkB (lanes 2), hMCMV-ES.NFkB/Ap1 (lanes 3), and hMCMV-ES.NFkB/Ap1-rev (lanes 4) viruses by PCR using M182 and AA3 primers. The amplified products were digested with restriction enzymes StuI and ApaI. Shown are the amplified products separated on a 2% agarose gel before and after StuI and ApaI treatment. Size markers are shown at the left, and product sizes are shown at the right.
FIG. 9.
FIG. 9.
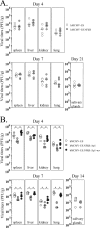
Infection of neonatal BALB/c mice with hMCMV-ES, hMCMV-ES.NFkB, hMCMV-ES.NFkB/Ap1, and hMCMV-ES.NFkB/Ap1-rev. (A) Growth kinetics of hMCMV-ES.NFkB in the newborn mice. Three-day-old BALB/c mice were i.p. inoculated with 5 × 10⁴ PFU of hMCMV-ES or hMCMV-ES.NFkB. Animals were sacrificed at the indicated times after infection, and viral titers from selected organs were determined. All values were above the limits of detection of the assay (4 × 101 PFU/g). Horizontal bars indicate the median values. The observed differences did not reach statistical difference (P > 0.05) as determined by the Mann-Whitney test (two-tailed). (B) Growth kinetics of hMCMV-ES.NFkB/Ap1 in the newborn mice. The experiment was similar to that in panel A, except that mice were inoculated with 5 × 10⁴ PFU of hMCMV-ES, hMCMV-ES.NFkB/Ap1, or hMCMV-ES.NFkB/Ap1-rev. Observed differences between hMCMV-ES.NFkB/Ap1 and control viruses hMCMV-ES and hMCMV-ES.NFkB/Ap1-rev that reached statistical differences (P > 0.05) as determined by the Mann-Whitney test (two-tailed) are indicated by an asterisk.

Similar articles

Cited by

References

    1. Amicone, L., et al. 1997. Transgenic expression in the liver of truncated Met blocks apoptosis and permits immortalization of hepatocytes. EMBO J. 16:495-503. - PMC - PubMed
    1. Angel, P., and M. Karin. 1991. The role of Jun, Fos, and the AP-1 complex in cell proliferation and transformation. Biochim. Biophys. Acta 1072:129-157. - PubMed
    1. Angel, P., et al. 1987. Phorbol ester-inducible genes contain a common cis element recognized by a TPA-modulated trans-acting factor. Cell 49:729-739. - PubMed
    1. Angulo, A., M. Messerle, U. H. Koszinowski, and P. Ghazal. 1998. Enhancer requirement for murine cytomegalovirus growth and genetic complementation by the human cytomegalovirus enhancer. J. Virol. 72:8502-8509. - PMC - PubMed
    1. Baskar, J. F., et al. 1996. Developmental analysis of the cytomegalovirus enhancer in transgenic animals. J. Virol. 70:3215-3226. - PMC - PubMed

Publication types

MeSH terms