. 2011 Jan 5;30(1):205-20.
doi: 10.1038/emboj.2010.290. Epub 2010 Nov 19.

Novel role and mechanism of protein inhibitor of activated STAT1 in spatial learning

Affiliations

Novel role and mechanism of protein inhibitor of activated STAT1 in spatial learning

Derek J C Tai et al. EMBO J. .

Abstract

By using differential display PCR, we have previously identified 98 cDNA fragments from rat dorsal hippocampus, which are expressed differentially between the fast learners and slow learners from water-maze learning task. One cDNA fragment, which showed a higher expression level in fast learners, encodes the rat protein inhibitor of activated STAT1 (pias1) gene. Spatial training induced a significant increase in PIAS1 expression in rat hippocampus. Transient transfection of the wild-type (WT) PIAS1 plasmid to CA1 neurons facilitated, whereas transfection of PIAS1 siRNA impaired spatial learning in rats. Meanwhile, PIAS1WT increased STAT1 sumoylation, decreased STAT1 DNA binding and decreased STAT1 phosphorylation at Tyr-701 associated with spatial learning facilitation. But PIAS1 siRNA transfection produced an opposite effect on these measures associated with spatial learning impairment. Further, transfection of STAT1 sumoylation mutant impaired spatial acquisition, whereas transfection of STAT1 phosphorylation mutant blocked the impairing effect of PIAS1 siRNA on spatial learning. In this study, we first demonstrate the role of PIAS1 in spatial learning. Both posttranslational modifications (increased sumoylation and decreased phosphorylation) mediate the effect of PIAS1 on spatial learning facilitation.


Conflict of interest statement

The authors declare that they have no conflict of interest.

Figures
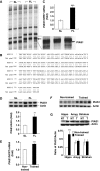
Figure 1
Figure 1
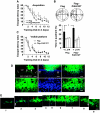
Identification of the pias1 gene, and PIAS1 expression is increased after spatial training. (A) DD–PCR of hippocampal RNA associated with water maze learning in rats. FL, fast learners; SL, slow learner. The lower right panel is the magnification of the portion marked by solid lines. (B) Alignment of the sequence of A33-7-2 (the arbitrary primers used) with rat pias1. The numbers correspond to the cDNA sequences. Vertical lines indicate identity. (C) Analysis of pias1 mRNA level in FL and SL by Q–PCR. (D) Analysis of PIAS1 protein level in FL and SL by western blot. (E) Analysis of pias1 mRNA level in trained and non-trained (swimming control) animals. (F) Representative gel pattern showing PIAS1 protein level in CA1 area from trained and non-trained animals. (G) Representative gel pattern and statistics for PIAS1 protein level in CA1 area, amygdala and striatum from trained and non-trained animals. N=6–7 each group. Data are mean±s.e.m. **P<0.01 and ***P<0.001 from Student's t-test.
Figure 2-
Figure 2-
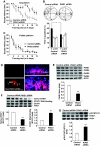
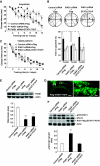
Overexpression of PIAS1 facilitates spatial learning, increases STAT1 sumoylation, decreases STAT1 DNA binding and decreased STAT1 phosphorylation at Tyr-701. PIAS1WT plasmid or Flag vector was transfected to rat CA1 area and animals were subjected to (A) water-maze learning and (B) probe trail test. T, target quadrant; L, left quadrant; O, opposite quadrant; R, right quadrant; •, start point; ▴, end point (C). The same transfection was made to different groups of rats and they were subjected to visible platform learning. (D) Immunohistochemistry showing the area of GFP–PIAS1WT transfection and the expression of PIAS1 in CA1 cell layer at different magnifications. Cells that show both green fluorescence (GFP) and blue fluorescence (DAPI) are cells successfully transfected with the plasmid. Dotted lines indicate the CA1 area. White arrows indicate the area of transfection and red arrows are markers for visualization of enlarged photos in (E). Scale bars equal 400 μm for the upper left panel, 100 μm for the upper middle panel, 50 μm for the upper right panel and 25 μm for the lower panels. (E) Enlargement of photos in upper panels of (D). The white arrows in slide 2 and slide 8 correspond to the two white arrows seen in the upper panels in (D). The red arrows (in slide 3 and slide 7) match with that seen in the upper middle panel in (D). Scale bar equals 25 μm.
Figure 2-
Figure 2-
(F) Immunostaining of Hochest and GFP in cultured hippocampal neurons after GFP–PIAS1WT transfection. Cells that show both green fluorescence (GFP) and blue fluorescence (Hochest) are cells successfully transfected with the plasmid. Scale bar equals 25 μm. (G) Representative gel pattern and statistics for STAT1 sumoylation, STAT1 DNA binding and anti-Flag (verification of transfection) after Flag–PIAS1WT transfection and probe trial test. (H) Representative gel pattern and statistics for STAT1 phosphorylation at Tyr-701 after Flag–PIAS1WT transfection and probe trial test. N=8–10 each group. (I) DNA gel electrophoresis showing the GFP fragment (129 bp) from Q–PCR analysis after GFP–PIAS1WT transfection to rat CA1 area. Control animals received PEI (the transfection reagent) injection only. The primers used for Q–PCR analysis of GFP–PIAS1 mRNA level were designed within the sequence of GFP (upper panel). Quantitative analysis and statistics showing the effect of GFP–PIAS1WT transfection on GFP–PIAS1 mRNA expression (lower panel). N=6 each group. Data are mean±s.e.m. *P<0.05, **P<0.01 and ***P<0.001 from Student's t-test.
Figure 3
Figure 3
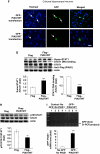
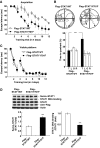
Transfection of PIAS1 siRNA impairs spatial learning, decreases STAT1 sumoylation, increases STAT1 DNA binding and increases STAT1 phosphorylation at Tyr-701. PIAS1 siRNA or control siRNA was transfected to CA1 area and rats were subjected to (A) water-maze learning and (B) probe trial test. (C) The same transfection was made to different groups of rats and they were subjected to visible platform learning. (D) Immunohistochemical staining against Cy3 and DAPI showing PIAS1 siRNA transfection to CA1 area at different magnifications. A control image (control siRNA without Cy3) is shown in the upper left panel and Cy3 image is shown in the lower left panel. The dotted lines indicate the CA1 area and arrows indicate the area of transfection. Scale bar=360 μm (lower left panel). Cells show both red fluorescence (Cy3) and blue fluorescence (DAPI) are cells successfully transfected with PIAS1 siRNA (right panels). Scale bar=40 μm for upper right panel and scale bar=10 μm for lower right panel. (E) Representative gel pattern for protein levels of PIAS1, PIAS2, PIAS3, PIAS4 and the statistics for PIAS1 expression after PIAS1 siRNA transfection to CA1 area and probe trial test. (F) Representative gel pattern and statistics for STAT1 sumoylation and STAT1 DNA binding after PIAS1 siRNA transfection to CA1 area and probe trial test. (G) Representative gel pattern and statistics for STAT1 phosphorylation at Tyr-701 after PIAS1 siRNA transfection to CA1 area and probe trial test. N=9 each group. Data are expressed as in Figure 2. **P<0.01 and ***P<0.001 from Student's t-test.
Figure 4
Figure 4
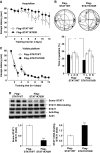
Transfection of STAT1K703R impairs spatial learning. Flag–STAT1WT or Flag–STAT1K703R plasmid was transfected to CA1 area and rats were subjected to (A) water-maze learning and (B) probe trial test. (C) The same transfection was made to different groups of rats and animals were subjected to visible platform learning. (D) Representative gel pattern and statistics for STAT1 sumoylation, STAT1 DNA binding and anti-Flag (verification of transfection) after plasmid transfection and probe trial test. N=7 each group. Data are expressed as in Figure 2. *P<0.05 and ***P<0.001 from Student's t-test.
Figure 5
Figure 5
Transfection of STAT1Y701F blocks the impairing effect of PIAS1 siRNA on spatial learning. Flag-vector, PIAS1 siRNA or PIAS1 siRNA together with STAT1Y701F was transfected to CA1 area and rats were subjected to (A) water-maze learning and (B) probe trial test. (C) The same transfection was made to different groups of rats and they were subjected to visible platform learning. (D) Immunohistochemistry showing a smaller area of transfection for 0.25μl Flag–STAT1Y701F injection to CA1 area as indicated by arrows. The anti-Flag antibody and FITC-conjugated IgG secondary antibody were used. Scale bar=240μm for the left panel and scale bar=15μm for the right panel. (E) Representative gel pattern and statistics for PIAS1 protein level after probe trial test. (F) Representative gel pattern and statistics for STAT1 phosphorylation at Tyr-701 and anti-Flag (verification of transfection) after probe trial test. N=9 each group. Data are expressed as in Figure 2. *P<0.05, **P<0.01 and ***P<0.001 from Student's t-test.
Figure 6
Figure 6
Transfection of STAT1Y701F enhances spatial learning. Flag–STAT1WT or Flag–STAT1Y701F plasmid was transfected to CA1 area and rats were subjected to (A) water-maze learning and (B) probe trial test. (C) The same transfection was made to different groups of rats and they were subjected to visible platform learning. (D) Representative gel pattern and statistics for STAT1 sumoylation, STAT1 DNA binding and anti-Flag (verification of transfection) after probe trial test. N=8 each group. Data are expressed as in Figure 2. ***P<0.001 from Student's t-test.
Figure 7
Figure 7
Level of PIAS1 expression, STAT1 sumoylation and STAT1 DNA binding is similar in CA1 area of naive rats. (A) Representative gel pattern and individual data of PIAS1 expression in randomly chosen, naive rats. (B) Representative gel pattern and (C, D) individual data of STAT1 sumoylation and STAT1 DNA binding in randomly chosen, naive rats. N=8.
Figure 8
Figure 8
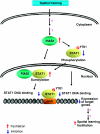
Schematic diagram showing the relationship among spatial training, PIAS1 expression, STAT1 sumoylation, STAT1 phosphorylation, STAT1 DNA binding and spatial learning facilitation. Spatial training upregulates PIAS1 expression in hippocampal CA1 area. PIAS1 expression leads to increased STAT1 sumoylation and decreased STAT1 phosphorylation at Tyr-701 (which further increases STAT1 sumoylation). Both events result in decreased STAT1 DNA binding activity and downregulation of STAT1-targeted gene expression. Downregulation of these gene expressions ultimately results in spatial learning facilitation.

Similar articles

Cited by

References

    1. Abdallah B, Hassan A, Benoist C, Goula D, Behr JP, Demeneix BA (1996) A powerful nonviral vector for in vivo gene transfer into the adult mammalian brain: polyethylenimine. Human Gene Ther 7: 1947–1954 - PubMed
    1. Arvin B, Neville LF, Barone FC, Feuerstein GZ (1996) The role of inflammation and cytokines in brain injury. Neurosci Biobehav Rev 20: 445–452 - PubMed
    1. Burger C, Lopez MC, Feller JA, Baker HV, Muzyczka N, Mandel RJ (2007) Changes in transcription within the CA1 field of the hippocampus are associated with age-related spatial learning impairments. Neurobiol Learn Mem 87: 21–41 - PubMed
    1. Castellucci VF, Kennedy TE, Kandel ER, Goelet P (1988) A quantitative analysis of 2-D gels identifies proteins in which labeling is increased following long-term sensitization in Aplysia. Neuron 1: 321–328 - PubMed
    1. Cavallaro S, D'Agata V, Manickam P, Dufour F, Alkon DL (2002) Memory-specific temporal profiles of gene expression in the hippocampus. Proc Natl Acad Sci USA 99: 16279–16284 - PMC - PubMed

Publication types