mRNA turnover rate limits siRNA and microRNA efficacy
- PMID: 21081925
- PMCID: PMC3010119
- DOI: 10.1038/msb.2010.89
mRNA turnover rate limits siRNA and microRNA efficacy
Abstract
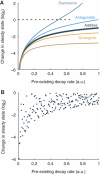
The microRNA pathway participates in basic cellular processes and its discovery has enabled the development of si/shRNAs as powerful investigational tools and potential therapeutics. Based on a simple kinetic model of the mRNA life cycle, we hypothesized that mRNAs with high turnover rates may be more resistant to RNAi-mediated silencing. The results of a simple reporter experiment strongly supported this hypothesis. We followed this with a genome-wide scale analysis of a rich corpus of experiments, including RT-qPCR validation data for thousands of siRNAs, siRNA/microRNA overexpression data and mRNA stability data. We find that short-lived transcripts are less affected by microRNA overexpression, suggesting that microRNA target prediction would be improved if mRNA turnover rates were considered. Similarly, short-lived transcripts are more difficult to silence using siRNAs, and our results may explain why certain transcripts are inherently recalcitrant to perturbation by small RNAs.
Conflict of interest statement
The authors declare that they have no conflict of interest.
Figures


Similar articles
-
RNAi revised--target mRNA-dependent enhancement of gene silencing.Nucleic Acids Res. 2015 Dec 15;43(22):10623-32. doi: 10.1093/nar/gkv1200. Epub 2015 Nov 17. Nucleic Acids Res. 2015. PMID: 26578554 Free PMC article.
-
Target mRNA abundance dilutes microRNA and siRNA activity.Mol Syst Biol. 2010 Apr 20;6:363. doi: 10.1038/msb.2010.24. Mol Syst Biol. 2010. PMID: 20404830 Free PMC article.
-
MicroRNAs and small interfering RNAs can inhibit mRNA expression by similar mechanisms.Proc Natl Acad Sci U S A. 2003 Aug 19;100(17):9779-84. doi: 10.1073/pnas.1630797100. Epub 2003 Aug 5. Proc Natl Acad Sci U S A. 2003. PMID: 12902540 Free PMC article.
-
Vigilance and validation: Keys to success in RNAi screening.ACS Chem Biol. 2011 Jan 21;6(1):47-60. doi: 10.1021/cb100358f. Epub 2010 Dec 28. ACS Chem Biol. 2011. PMID: 21142076 Free PMC article. Review.
-
Interconnections between mRNA degradation and RDR-dependent siRNA production in mRNA turnover in plants.J Plant Res. 2017 Mar;130(2):211-226. doi: 10.1007/s10265-017-0906-8. Epub 2017 Feb 14. J Plant Res. 2017. PMID: 28197782 Review.
Cited by
-
Advances in microRNA experimental approaches to study physiological regulation of gene products implicated in CNS disorders.Exp Neurol. 2012 Jun;235(2):402-18. doi: 10.1016/j.expneurol.2011.12.043. Epub 2012 Jan 5. Exp Neurol. 2012. PMID: 22245616 Free PMC article. Review.
-
RNAi revised--target mRNA-dependent enhancement of gene silencing.Nucleic Acids Res. 2015 Dec 15;43(22):10623-32. doi: 10.1093/nar/gkv1200. Epub 2015 Nov 17. Nucleic Acids Res. 2015. PMID: 26578554 Free PMC article.
-
Identification of a new target of miR-16, Vacuolar Protein Sorting 4a.PLoS One. 2014 Jul 17;9(7):e101509. doi: 10.1371/journal.pone.0101509. eCollection 2014. PLoS One. 2014. PMID: 25033200 Free PMC article.
-
Principles of miRNA-target regulation in metazoan models.Int J Mol Sci. 2013 Aug 7;14(8):16280-302. doi: 10.3390/ijms140816280. Int J Mol Sci. 2013. PMID: 23965954 Free PMC article. Review.
-
Short-interference RNAs: becoming medicines.EXCLI J. 2015 Jun 15;14:714-46. doi: 10.17179/excli2015-297. eCollection 2015. EXCLI J. 2015. PMID: 26648823 Free PMC article.
References
-
- Elbashir SM, Harborth J, Lendeckel W, Yalcin A, Weber K, Tuschl T (2001) Duplexes of 21-nucleotide RNAs mediate RNA interference in cultured mammalian cells. Nature 411: 494–498 - PubMed
Publication types
MeSH terms
Substances
LinkOut - more resources
Full Text Sources

