C. elegans mutant identification with a one-step whole-genome-sequencing and SNP mapping strategy
- PMID: 21079745
- PMCID: PMC2975709
- DOI: 10.1371/journal.pone.0015435
C. elegans mutant identification with a one-step whole-genome-sequencing and SNP mapping strategy
Abstract
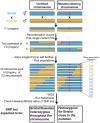
Whole-genome sequencing (WGS) is becoming a fast and cost-effective method to pinpoint molecular lesions in mutagenized genetic model systems, such as Caenorhabditis elegans. As mutagenized strains contain a significant mutational load, it is often still necessary to map mutations to a chromosomal interval to elucidate which of the WGS-identified sequence variants is the phenotype-causing one. We describe here our experience in setting up and testing a simple strategy that incorporates a rapid SNP-based mapping step into the WGS procedure. In this strategy, a mutant retrieved from a genetic screen is crossed with a polymorphic C. elegans strain, individual F2 progeny from this cross is selected for the mutant phenotype, the progeny of these F2 animals are pooled and then whole-genome-sequenced. The density of polymorphic SNP markers is decreased in the region of the phenotype-causing sequence variant and therefore enables its identification in the WGS data. As a proof of principle, we use this strategy to identify the molecular lesion in a mutant strain that produces an excess of dopaminergic neurons. We find that the molecular lesion resides in the Pax-6/Eyeless ortholog vab-3. The strategy described here will further reduce the time between mutant isolation and identification of the molecular lesion.
Conflict of interest statement
Figures


Similar articles
-
Whole genome sequencing highlights genetic changes associated with laboratory domestication of C. elegans.PLoS One. 2010 Nov 11;5(11):e13922. doi: 10.1371/journal.pone.0013922. PLoS One. 2010. PMID: 21085631 Free PMC article.
-
Rapid and Efficient Identification of Caenorhabditis elegans Legacy Mutations Using Hawaiian SNP-Based Mapping and Whole-Genome Sequencing.G3 (Bethesda). 2015 Mar 4;5(5):1007-19. doi: 10.1534/g3.115.017038. G3 (Bethesda). 2015. PMID: 25740937 Free PMC article.
-
Comparing platforms for C. elegans mutant identification using high-throughput whole-genome sequencing.PLoS One. 2008;3(12):e4012. doi: 10.1371/journal.pone.0004012. Epub 2008 Dec 24. PLoS One. 2008. PMID: 19107202 Free PMC article.
-
Harnessing the power of genetics: fast forward genetics in Caenorhabditis elegans.Mol Genet Genomics. 2021 Jan;296(1):1-20. doi: 10.1007/s00438-020-01721-6. Epub 2020 Sep 4. Mol Genet Genomics. 2021. PMID: 32888055 Review.
-
Single-nucleotide polymorphism mapping.Methods Mol Biol. 2006;351:75-92. doi: 10.1385/1-59745-151-7:75. Methods Mol Biol. 2006. PMID: 16988427 Review.
Cited by
-
A genetic screen for temperature-sensitive morphogenesis-defective Caenorhabditis elegans mutants.G3 (Bethesda). 2021 Apr 15;11(4):jkab026. doi: 10.1093/g3journal/jkab026. G3 (Bethesda). 2021. PMID: 33713117 Free PMC article.
-
Steroid hormone pathways coordinate developmental diapause and olfactory remodeling in Pristionchus pacificus.Genetics. 2021 Jun 24;218(2):iyab071. doi: 10.1093/genetics/iyab071. Genetics. 2021. PMID: 33963848 Free PMC article.
-
toca-1 is in a novel pathway that functions in parallel with a SUN-KASH nuclear envelope bridge to move nuclei in Caenorhabditis elegans.Genetics. 2013 Jan;193(1):187-200. doi: 10.1534/genetics.112.146589. Epub 2012 Nov 12. Genetics. 2013. PMID: 23150597 Free PMC article.
-
CloudMap: a cloud-based pipeline for analysis of mutant genome sequences.Genetics. 2012 Dec;192(4):1249-69. doi: 10.1534/genetics.112.144204. Epub 2012 Oct 10. Genetics. 2012. PMID: 23051646 Free PMC article.
-
MJL-1 is a nuclear envelope protein required for homologous chromosome pairing and regulation of synapsis during meiosis in C. elegans.Sci Adv. 2023 Feb 10;9(6):eadd1453. doi: 10.1126/sciadv.add1453. Epub 2023 Feb 8. Sci Adv. 2023. PMID: 36753547 Free PMC article.
References
-
- Shendure J, Ji H. Next-generation DNA sequencing. Nat Biotechnol. 2008;26:1135–1145. - PubMed
Publication types
MeSH terms
Substances
Grants and funding
LinkOut - more resources
Full Text Sources
Other Literature Sources
Research Materials
Miscellaneous

