. 2010 Nov 4;6(11):e1000975.
doi: 10.1371/journal.pcbi.1000975.

Scalable rule-based modelling of allosteric proteins and biochemical networks

Affiliations

Scalable rule-based modelling of allosteric proteins and biochemical networks

Julien F Ollivier et al. PLoS Comput Biol. .

Abstract

Much of the complexity of biochemical networks comes from the information-processing abilities of allosteric proteins, be they receptors, ion-channels, signalling molecules or transcription factors. An allosteric protein can be uniquely regulated by each combination of input molecules that it binds. This "regulatory complexity" causes a combinatorial increase in the number of parameters required to fit experimental data as the number of protein interactions increases. It therefore challenges the creation, updating, and re-use of biochemical models. Here, we propose a rule-based modelling framework that exploits the intrinsic modularity of protein structure to address regulatory complexity. Rather than treating proteins as "black boxes", we model their hierarchical structure and, as conformational changes, internal dynamics. By modelling the regulation of allosteric proteins through these conformational changes, we often decrease the number of parameters required to fit data, and so reduce over-fitting and improve the predictive power of a model. Our method is thermodynamically grounded, imposes detailed balance, and also includes molecular cross-talk and the background activity of enzymes. We use our Allosteric Network Compiler to examine how allostery can facilitate macromolecular assembly and how competitive ligands can change the observed cooperativity of an allosteric protein. We also develop a parsimonious model of G protein-coupled receptors that explains functional selectivity and can predict the rank order of potency of agonists acting through a receptor. Our methodology should provide a basis for scalable, modular and executable modelling of biochemical networks in systems and synthetic biology.


Conflict of interest statement

The authors have declared that no competing interests exist.

Figures

Figure 1
Figure 1. The Allosteric Network Compiler – modelling elements and methodological flowchart.
(A) Example structures. Each structure has a name (underlined) and comprises a set of named components. Hierarchical components (triangles) represent part or all of a biomolecule and contain, as denoted by arrows, one or more interaction sites (circles). Left: The structure X represents a simple ligand with a single binding site (circle with horizontal bar). Centre-left: The structure A represents a generic, divalent allosteric adaptor protein. The adaptor's hierarchical component is allosteric (indicated by a tilde) and transitions between low (R) and high-affinity (T) conformational states. The dashed lines indicate that each binding site acts as a modifier for the allosteric transition, with each interaction parameterized by the indicated Φ-value, and that ligands can distinguish each conformation. Centre-right: The structure R is a simplified model of the nicotinic aceltylcholine receptor (nAChR), following Edelstein et al. but without desensitized states. The allosteric component transitions between closed (C) and open (O) states. Right: The structure K is a model of a mitogen activated protein kinase (MAPK) with two activating phosphorylation sites (circles with vertical bar and a grey dot as a placeholder for the state) and a catalytic site (circle with cross). The allosteric component transitions between inactive (I) and active (A) states. Both the phosphorylation sites and the catalytic site are modifiers of the allosteric transition: each successive phosphorylation biases the equilibrium of the enzyme towards the active state by a regulatory factor ΓY1 or ΓY2. Each of these interactions is also parameterized by a distinct Φ-value. (B) Example rules. A pair of binding rules for the adaptor A and the ligand X specify the association and dissociation rates of AX with X when AX is in the R and T states, a similar pair (not shown) specifies the rates for AY and Y, and we define the affinities KRX and KTX implied by the rates (in gray, e.g. KRX = kfRX/kbRX). A covalent modification rule for the kinase K acting on an unphosphorylated (open dot) downstream target Y follows the Michaelis-Menten mechanism for enzyme-substrate interactions and yields a phosphorylated substrate (filled dot). (C) Methodological flowchart. In a model of the adaptor protein A and its ligands X and Y (Figure 7 of Text S1), the rules state that both ligands bind with higher affinity to the T state of the adaptor. This model is compiled by ANC to generate a reaction network where horizontal transitions correspond to conformational changes, vertical transitions correspond to binding the ligand X, and transitions into the page represent binding the ligand Y. KRT is the allosteric equilibrium constant, while the regulatory factors ΓX and ΓY are the differential affinity of the ligands to each conformation of A and are calculated by ANC using the rate constants given in the rules (e.g. ΓX = KTX/KRX). The reaction network is converted into ordinary differential equations by Facile and these are simulated in Matlab to compute the output response of the system (bound AY vs. X, with ATOT = 1, YTOT = 1, KRT = 10−3 KRX = 0.1, KTX = 10, KRY = 0.01, KTY = 100, arbitrary units).
Figure 2
Figure 2. Allostery makes macromolecular assembly robust and controllable.
(A) Effect of allostery on macromolecular assembly when a linker component is over-expressed. Each curve shows the equilibrium concentration of the XAY trimer against the total amount of A. The total amount of X and Y was unity, while KRT and the affinities of X and Y to each conformation of A (KRX, KRY, KTX, KTY) were chosen to yield a desired value of θ and with KX = KY = 1. Inset: A coarse-grained version of the divalent protein model of Figure 1C sums over the two possible conformations of A and shows that with KX, KY and the concentrations of X and Y held constant, the efficacy of assembly depends only on the cooperativity parameter θ. (B) Regulation of cooperativity and assembly. The value of θ depends on the other parameters of the model through Equation 1, which is plotted against KRT on one axis and ΓX and ΓY (assumed equal) on the other. Increasing ΓX and ΓY always increases cooperativity, however θ has a maximum value as KRT is changed.
Figure 3
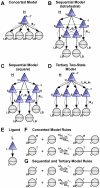
Figure 3. Classic and general models of allostery and protein structure are described by our modelling framework.
(A) A concerted model of a tetrameric allosteric protein has one allosteric component and 4 identical interaction sites to represent each subunit. The dashed lines indicate that each ligand-binding site is a modifier for the RT allosteric transition and all 4 interactions are identically parameterized by ΦLB. (B) In a sequential model of the protein, a top-level hierarchical component comprises 4 identical allosteric components that individually change conformation and bind ligand. These components are allosterically coupled (dashed lines) such that each subunit is equivalent and a modifier for all neighbouring subunits – the “tetrahedral” model. The strength of the coupling is given by the regulatory factor ΓS and the effect of each modifier on the kinetics of coupled components is parametrized by ΦLB and ΦS. (C) Altered lateral interactions between subunits gives the “square” model. (D) A tertiary two-state model has one allosteric hierarchical component containing 4 identical allosteric components, each with a ligand-binding site. The upper quaternary component is allosterically coupled to each tertiary component with strength Γ and the tertiary components are coupled to their binding site. The effect of the quaternary conformation on the kinetics of the tertiary transition is given by ΦQ, and the reciprocal interaction is parameterized by ΦT. (E) The ligand for all four models. (F) Rules for the concerted model in panel A. (G) Rules for the models in panels B, C and D.
Figure 4
Figure 4. Cooperative binding of competitive ligands to the concerted and sequential models.
The allosteric equilibrium of an unligated protein favours a state T (or t). Ligand L0 binds preferentially to state R (or r) and so binds cooperatively to the protein. The Hill coefficient of the dose-response function for L0 (the number of L0 bound to the protein versus the concentration of L0) was measured in the presence of increasing concentrations of three competing ligands: L1 favours the R state; L2 is neutral; L3 favours the T state. Concentrations of competing ligands are normalized to the EC50 of their own occupancy function. For the concerted model KRT = 103; for the sequential (tetrahedral) model Krt = 0.1 and ΓS = 10. Ligand affinities were set to KRLi = KrLi = (Γi)−1/2 and KTLi = KtLi = (Γi)1/2 with Γ0 = Γ1 = 0.01 (prefers R or r), Γ2 = 1 and Γ3 = 100 (prefers T or t).
Figure 5
Figure 5. Cubic and quartic ternary complex models of a GPCR in our modelling framework.
The mapping between the cubic (A) and quartic (B) models shows how the two models are related. (A) A naive implementation of the cubic ternary complex model. The ANC-structure R has one allosteric component which transitions between a low-affinity, inactive (i) state and a high-affinity, active (a) state with the indicated equilibrium constant (in gray). LB and GB are binding sites for an extracellular ligand L (not shown) and an intracellular target G protein (not shown). In the corresponding cubic, 8-state transition diagram Kact is the unligated allosteric equilibrium constant, Ka and Kg are ligand affinities to the reference (inactive) state, and α and β are ratios of affinities. We parenthesize the cooperativity parameters δ and γ to indicate that these parameters of the cubic ternary complex model have to be added as ad hoc rules to the naïve implementation. (B) In our quartic ternary complex model, an ANC-structure R comprises two allosteric components: the extracellular domain ED transitions between low and high-affinity states (s and t); the intracellular domain ID transitions between inactive and active states (i and a). These transitions are reciprocally linked (dashed line) so each domain acts a modifier of the other with the interaction parameterized by Γ and Φ. The binding sites are allosterically coupled to both allosteric components, therefore each ligand “sees” 4 possible conformations of the receptor. In the quartic state-transition diagram KactG and KactL are the unligated allosteric equilibrium constants, Г is the regulatory factor linking the st and ia transitions, Ka′ and Kg′ are ligand affinities to the reference state si, and α and β are ratios of ligand affinities of the subscripted state relative to the reference state. For clarity, we show only the unligated st transition. (C) Rules for the cubic ternary complex model showing the rate and equilibrium constants for ligand and G protein binding. (D) A subset of the rules for the quartic ternary complex model shows the rate and equilibrium constants for ligand binding. A similar set of rules specifies rate and equilibrium constants for binding G protein (Figure 9 of Text S1).
Figure 6
Figure 6. Functional selectivity of agonists in the quartic ternary complex model.
(A, B) We simulated the GPCR-mediated (in)activation two target G proteins by several ligands. A dose-response for each ligand and G protein pair shows the amount of receptor species capable of signalling (RsaG+RtaG+LRsaG+LRtaG) as a fraction of the total number of receptors and against the concentration of ligand (arbitrary units). The concentrations of receptor and G protein are unity. Parameter values: KactL = 1, KactG = 0.05, Γ = 1, affinities for L1 are given by: (Ka′, αt, αa, αat) = (10,0.1,10,1), for L2: (1,20,20,400), L3: (0.1,10,10,0.01), L4: (100,0.1,0.4,0.01) L5: (20,20,0.05,5), G1: (Kg′, βt, βa, βat) = (10,0.1,10,1) and G2: (1,10,10,100).

Similar articles

Cited by

References

    1. Hartwell LH, Hopfield JJ, Leibler S, Murray AW. From molecular to modular cell biology. Nature. 1999;402:C47–52. - PubMed
    1. Tyson JJ, Chen KC, Novak B. Sniffers, buzzers, toggles and blinkers: dynamics of regulatory and signaling pathways in the cell. Curr Opin Cell Biol. 2003;15:221–231. - PubMed
    1. Alon U. Network motifs: theory and experimental approaches. Nat Rev Genet. 2007;8:450–461. - PubMed
    1. Bray D. Protein molecules as computational elements in living cells. Nature. 1995;376:307–312. - PubMed
    1. Pawson T. Protein modules and signalling networks. Nature. 1995;373:573–580. - PubMed

Publication types