

Interaction of two phagocytic host defense systems: Fcγ receptors and complement receptor 3
- PMID: 21044955
- PMCID: PMC3012970
- DOI: 10.1074/jbc.M110.163030
Interaction of two phagocytic host defense systems: Fcγ receptors and complement receptor 3
Abstract
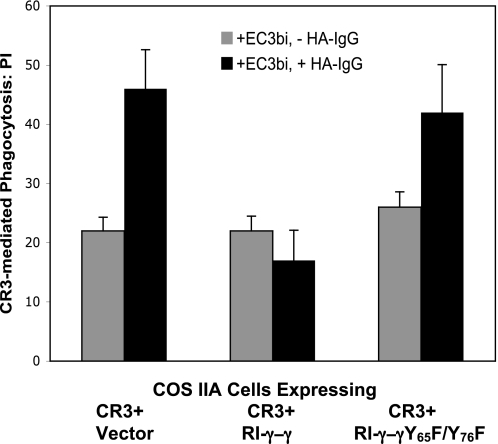
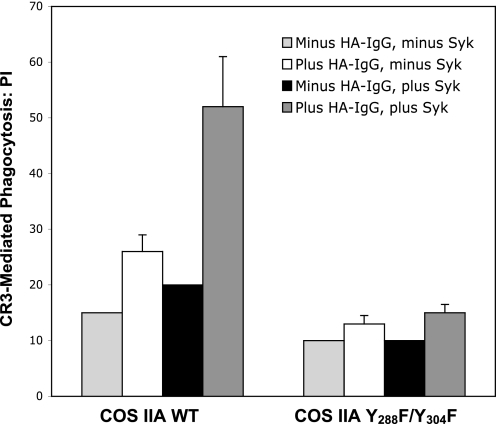
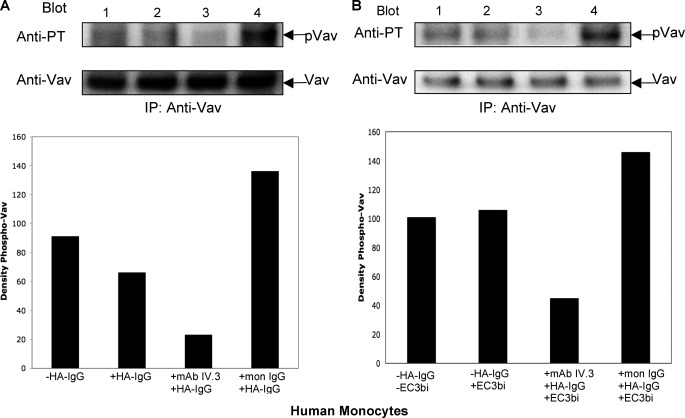
Phagocytosis of foreign pathogens by cells of the immune system is a vitally important function of innate immunity. The phagocytic response is initiated when ligands on the surface of invading microorganisms come in contact with receptors on the surface of phagocytic cells such as neutrophils, monocytes/macrophages, and dendritic cells. The complement receptor CR3 (CD11b/CD18, Mac-1) mediates the phagocytosis of complement protein (C3bi)-coated particles. Fcγ receptors (FcγRs) bind IgG-opsonized particles and provide a mechanism for immune clearance and phagocytosis of IgG-coated particles. We have observed that stimulation of FcγRs modulates CR3-mediated phagocytosis and that FcγRIIA and FcγRI exert opposite (stimulatory and inhibitory) effects. We have also determined that an intact FcγR immunoreceptor tyrosine-based activation motif is required for these effects, and we have investigated the involvement of downstream effectors. The ability to up-regulate or down-regulate CR3 signaling has important implications for therapeutics in disorders involving the host defense system.
Figures
Similar articles
-
Fcgamma-receptors induce Mac-1 (CD11b/CD18) mobilization and accumulation in the phagocytic cup for optimal phagocytosis.J Biol Chem. 2003 Nov 14;278(46):45720-9. doi: 10.1074/jbc.M303704200. Epub 2003 Aug 26. J Biol Chem. 2003. PMID: 12941957
-
Complement receptor 3 mediates both sinking phagocytosis and phagocytic cup formation via distinct mechanisms.J Biol Chem. 2021 Jan-Jun;296:100256. doi: 10.1016/j.jbc.2021.100256. Epub 2021 Jan 8. J Biol Chem. 2021. PMID: 33839682 Free PMC article.
-
Release of arachidonic acid by stimulation of opsonic receptors in human monocytes: the FcgammaR and the complement receptor 3 pathways.J Biol Chem. 2003 Dec 26;278(52):52179-87. doi: 10.1074/jbc.M310905200. Epub 2003 Oct 7. J Biol Chem. 2003. PMID: 14532278
-
Tyrosine phosphorylation and Fcgamma receptor-mediated phagocytosis.FEBS Lett. 1997 Jan 2;400(1):11-4. doi: 10.1016/s0014-5793(96)01359-2. FEBS Lett. 1997. PMID: 9000504 Review.
-
Microglia and macrophage activation and the regulation of complement-receptor-3 (CR3/MAC-1)-mediated myelin phagocytosis in injury and disease.J Mol Neurosci. 2003;21(1):65-72. doi: 10.1385/JMN:21:1:65. J Mol Neurosci. 2003. PMID: 14500997 Review.
Cited by
-
T cell-extrinsic CD18 attenuates antigen-dependent CD4+ T cell activation in vivo.J Immunol. 2015 May 1;194(9):4122-9. doi: 10.4049/jimmunol.1401328. Epub 2015 Mar 23. J Immunol. 2015. PMID: 25801431 Free PMC article.
-
Neutrophil-Specific Knockdown of β2 Integrins Impairs Antifungal Effector Functions and Aggravates the Course of Invasive Pulmonal Aspergillosis.Front Immunol. 2022 Jun 6;13:823121. doi: 10.3389/fimmu.2022.823121. eCollection 2022. Front Immunol. 2022. PMID: 35734179 Free PMC article.
-
New insights into the regulation of neutrophil NADPH oxidase activity in the phagosome: a focus on the role of lipid and Ca(2+) signaling.Antioxid Redox Signal. 2013 Feb 20;18(6):661-76. doi: 10.1089/ars.2012.4773. Epub 2012 Sep 18. Antioxid Redox Signal. 2013. PMID: 22867131 Free PMC article. Review.
-
Functional Characterization of Largemouth Bass (Micropterus salmoides) Soluble FcγR Homolog in Response to Bacterial Infection.Int J Mol Sci. 2022 Nov 9;23(22):13788. doi: 10.3390/ijms232213788. Int J Mol Sci. 2022. PMID: 36430268 Free PMC article.
-
RNA-Seq Analysis of Colorectal Tumor-Infiltrating Myeloid-Derived Suppressor Cell Subsets Revealed Gene Signatures of Poor Prognosis.Front Oncol. 2020 Nov 10;10:604906. doi: 10.3389/fonc.2020.604906. eCollection 2020. Front Oncol. 2020. PMID: 33312958 Free PMC article.
References
-
- Ehlers M. R. (2000) Microbes Infection 2, 289–294 - PubMed
-
- Gasque P. (2004) Mol. Immunol. 41, 1089–1098 - PubMed
-
- Köhl J. (2006) Adv. Exp. Med. Biol. 586, 71–94 - PubMed
-
- Morgan B. P., Harris C. L. (2003) Mol. Immunol. 40, 159–170 - PubMed
-
- Ross G. D., Vetvicka V., Yan J., Xia Y., Vetvicková J. (1999) Immunopharmacology 42, 61–74 - PubMed
MeSH terms
Substances
LinkOut - more resources
Full Text Sources
Research Materials
