. 2011 Jan 7;286(1):331-40.
doi: 10.1074/jbc.M110.162644. Epub 2010 Oct 27.

The DNA damage response pathway regulates the alternative splicing of the apoptotic mediator Bcl-x

Affiliations

The DNA damage response pathway regulates the alternative splicing of the apoptotic mediator Bcl-x

Lulzim Shkreta et al. J Biol Chem. .

Abstract

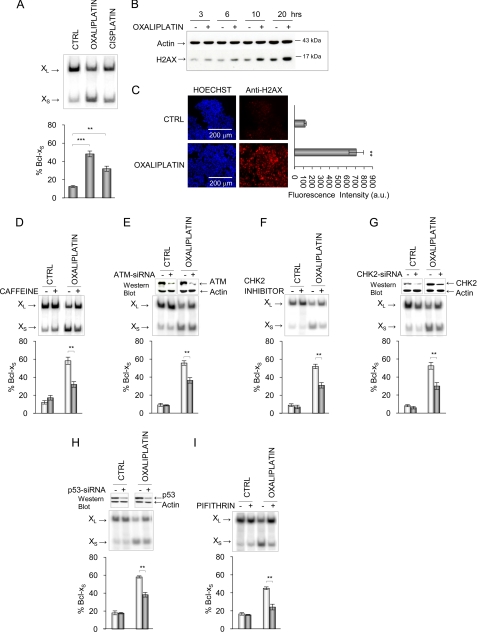
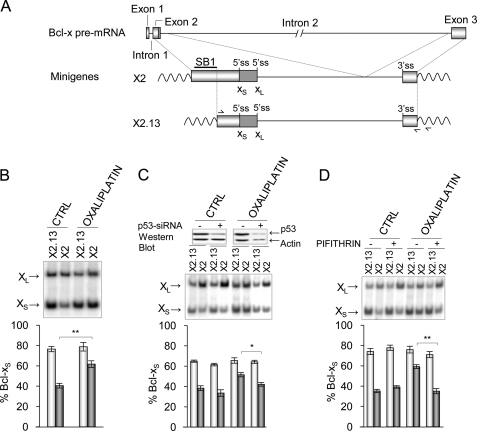
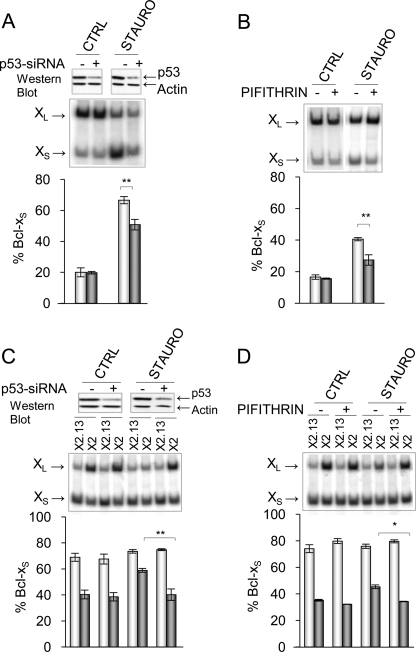
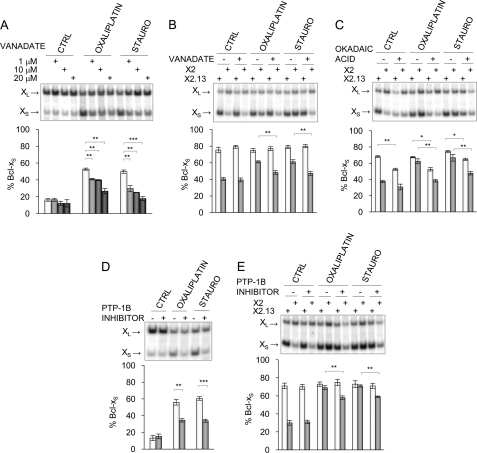
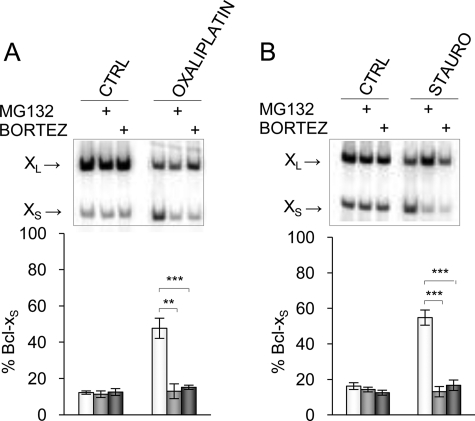
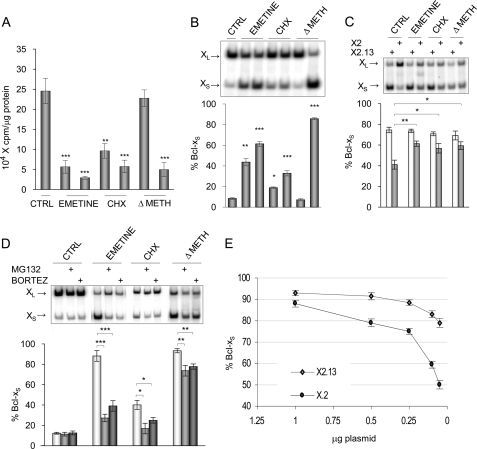
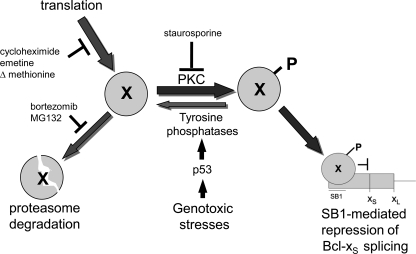
Alternative splicing often produces effectors with opposite functions in apoptosis. Splicing decisions must therefore be tightly connected to stresses, stimuli, and pathways that control cell survival and cell growth. We have shown previously that PKC signaling prevents the production of proapoptotic Bcl-x(S) to favor the accumulation of the larger antiapoptotic Bcl-x(L) splice variant in 293 cells. Here we show that the genotoxic stress induced by oxaliplatin elicits an ATM-, CHK2-, and p53-dependent splicing switch that favors the production of the proapoptotic Bcl-x(S) variant. This DNA damage-induced splicing shift requires the activity of protein-tyrosine phosphatases. Interestingly, the ATM/CHK2/p53/tyrosine phosphatases pathway activated by oxaliplatin regulates Bcl-x splicing through the same regulatory sequence element (SB1) that receives signals from the PKC pathway. Convergence of the PKC and DNA damage signaling routes may control the abundance of a key splicing repressor because SB1-mediated repression is lost when protein synthesis is impaired but is rescued by blocking proteasome-mediated protein degradation. The SB1 splicing regulatory module therefore receives antagonistic signals from the PKC and the p53-dependent DNA damage response pathways to control the balance of pro- and antiapoptotic Bcl-x splice variants.


Figures

FIGURE 1.
FIGURE 1.
Impact of the DNA damage pathway on Bcl-x splicing. A, total RNA was extracted from 293 cells treated with 10 μm oxaliplatin or cisplatin. RT-PCR analysis was performed to amplify the Bcl-x splice products that were then fractionated in acrylamide gels (20). The Bcl-xL (456 bp) and Bcl-xS (267 bp) products are indicated. B, Western analysis of total protein with the anti-H2AX antibody (and anti-β-actin as a control) following treatment of 293 cells for various times (h) with oxaliplatin. C, immunofluorescence assays with the anti-H2AX antibody after treating 293 cells with oxaliplatin for 24 h. Hoechst staining was performed to visualize nuclei. The mean intensity of positive cells in untreated and treated cells was measured with the Pathway microscope (BD Biosciences) and is plotted in the graph on the right. D, impact on Bcl-x splicing after a pretreatment with caffeine for 1 h (7.5 μm). E, siRNA-mediated knockdown of ATM prior to the addition of oxaliplatin for 24 h in 293 cells. F, impact of the CHK2 inhibitor (10 μm). G, siRNA-mediated knockdown of CHK2 prior to the addition of oxaliplatin for 24 h in 293 cells. In H and I, 293 cells were treated with a p53-specific siRNA (catalog no. 1024849; Qiagen) or the p53 inhibitor pifithrin-α (20 μm) and then incubated with oxaliplatin. Western analysis was carried out to assess the RNAi-induced drop in ATM, CHK2, and p53 (top of G and H). Following all RT-PCR analysis in triplicate experiments, the relative abundance of the Bcl-xS splice form was plotted in graphs and expressed as mean ± S.D. (error bars). **, p < 0.01; ***, p < 0.001 compared with control or as indicated. CTRL, control.
FIGURE 2.
FIGURE 2.
Oxaliplatin modulates Bcl-x splicing through the SB1 element. A, representation of the exon-intron organization of the BCL2L1 (Bcl-x) gene. The portion included in minigenes X2 and X2.13 is shown, and the SB1 region is indicated. The position of the competing 5′ splice sites and of the primers used for RT-PCR analysis of plasmid-derived transcripts is indicated. The most downstream primer shown on X2.13 hybridizes to the plasmidic portion of the sequence and was used for the reverse transcriptase step. B, 293 cells were transfected with plasmids pHIV-X2 and pHIV-X2.13. After 4 h, cells were treated for 24 h with or without oxaliplatin. C, 48 h after transfection with a p53-specific siRNA, minigenes were transfected, and 4 h later, 293 cells were treated for 24 h with or without oxaliplatin. Western analysis is shown at the top to display the relative levels of p53 and β-actin. D, 3 h after 293 cells were transfected with minigenes, they were treated for 1 h with pifithrin-α (20 μm) and then with both pifithrin and oxaliplatin for 24 h. In all cases, the Bcl-x splicing profile was measured by RT-PCR after extraction of total RNA. The percentage of Bcl-xS was plotted based on experiments performed in triplicates with S.D. values (error bars). p values are represented by asterisks (*, p < 0.05; **, p < 0.01). CTRL, control.
FIGURE 3.
FIGURE 3.
Convergence of the PKC and DNA damage response pathways. A and B, the impact of a p53 depletion and inhibition was tested in 293 cells treated with the PKC inhibitor staurosporine (STAURO; 60 nm). In C and D, the X2 and X2.13 minigenes were transfected into 293 cells that were treated with the siRNA against p53 or a treatment with the p53 inhibitor pifithrin. Western analysis was conducted to assess the level of p53 (top of panels). The bottom of all panels depicts labeled RT-PCR products derived from triplicate experiments plotted as described previously. p values are represented by asterisks (*, p < 0.05; **, p < 0.01; ***, p < 0.001). Error bars, S.D. CTRL, control.
FIGURE 4.
FIGURE 4.
Tyrosine phosphatase inhibitors affect the SB1-mediated splicing control. A, increasing concentrations of the tyrosine phosphatase inhibitor orthovanadate (0, 1, 10, and 20 μm) were used to pretreat 293 cells for 1 h prior to the application of oxaliplatin and staurosporine (STAURO). B, 4 h post-transfection with the X2 and X2.13 minigenes, 293 cells were pretreated for 1 h with 15 μm orthovanadate before adding drugs. C, using a protocol identical to that in B, okadaic acid was used to examine the SB1-dependent response using the X2 and X2.13 minigenes. D, the PTP-1B inhibitor (50 μm) was used to pretreat 293 cells for 1 h prior to the application of oxaliplatin and staurosporine. E, 4 h post-transfection with the X2 and X2.13 minigenes, 293 cells were pretreated for 1 h with 50 μm of the PTP-1B inhibitor before adding drugs. In all cases, total RNA was extracted 24 h after the oxaliplatin and staurosporine treatments, and RT-PCR analysis was carried out as described previously. The results of triplicate experiments are plotted. p values are represented by asterisks (*, p < 0.05; **, p < 0.01; ***, p < 0.001). Error bars, S.D. CTRL, control.
FIGURE 5.
FIGURE 5.
Proteasome-mediated protein degradation affects Bcl-x splicing. 293 cells were pretreated with bortezomib or MG132 or mock-treated and then incubated with oxaliplatin (A) and staurosporine (B). Total RNA was extracted, and the Bcl-x splicing profile was measured by RT-PCR. Following quantitation, the percentage of Bcl-xS product was plotted below each panel for experiments performed in triplicates with S.D. values (error bars). p values are represented by asterisks (**, p < 0.01; ***, p < 0.001). CTRL, control.
FIGURE 6.
FIGURE 6.
Impact of protein synthesis on Bcl-x splicing. A, [35S]cysteine incorporation assays were carried out after applying emetine (0.2 and 0.5 μm for 20 h) or cycloheximide (CHX; 0.75 and 1.5 μg/ml for 20 h) or using a medium lacking methionine (and cysteine only for this assay) (ΔMET; 75 and 100% depleted). B, RNA from cells treated in A was extracted, and the Bcl-x splicing profile was measured by RT-PCR. C, the HIV-X2 and HIV-X2.13 Bcl-x minigenes were transfected in 293 cells. After 4 h, cells were treated for 20 h with emetine (0.5 μm), cycloheximide (1.5 μg/ml), or a medium lacking methionine. A non-treated control was included. D, 293 cells were pretreated with bortezomib or MG132 or mock-treated and then treated to inhibit protein synthesis. In all panels except A, total RNA was extracted, and the Bcl-x splicing profile was measured by RT-PCR. Following quantitation, the percentage of Bcl-xS product was plotted below each panel for experiments performed in triplicates with S.D. values (error bars). p values are represented by asterisks (*, p < 0.05; **, p < 0.01; ***, p < 0.001). E, different amounts of CMV-X2 and CMV-X2.13 plasmids were transfected in 293 cells. Total RNA was extracted, and the Bcl-x splicing profile was measured by RT-PCR. CTRL, control.
FIGURE 7.
FIGURE 7.
Regulation of Bcl-x splicing through the SB1 element. Shown is a model depicting the pathways that affect the activity of the putative unphosphorylated or phosphorylated splicing repressor (X or Xp, respectively) that binds to SB1 and down-regulates the production of Bcl-xS (for details, see “Discussion”).

Similar articles

Cited by

References

    1. Adams J. M. (2003) Genes Dev. 17, 2481–2495 - PubMed
    1. Green D. R., Kroemer G. (2004) Science 305, 626–629 - PubMed
    1. Schwerk C., Schulze-Osthoff K. (2005) Mol. Cell 19, 1–13 - PubMed
    1. Jiang Z. H., Wu J. Y. (1999) Proc. Soc. Exp. Biol. Med. 220, 64–72 - PubMed
    1. Wu J. Y., Tang H., Havlioglu N. (2003) Prog. Mol. Subcell Biol. 31, 153–185 - PubMed

Publication types

MeSH terms