

Genetic diversity and striatal gene networks: focus on the heterogeneous stock-collaborative cross (HS-CC) mouse
- PMID: 20959017
- PMCID: PMC3091732
- DOI: 10.1186/1471-2164-11-585
Genetic diversity and striatal gene networks: focus on the heterogeneous stock-collaborative cross (HS-CC) mouse
Abstract
Background: The current study focused on the extent genetic diversity within a species (Mus musculus) affects gene co-expression network structure. To examine this issue, we have created a new mouse resource, a heterogeneous stock (HS) formed from the same eight inbred strains that have been used to create the collaborative cross (CC). The eight inbred strains capture > 90% of the genetic diversity available within the species. For contrast with the HS-CC, a C57BL/6J (B6) × DBA/2J (D2) F2 intercross and the HS4, derived from crossing the B6, D2, BALB/cJ and LP/J strains, were used. Brain (striatum) gene expression data were obtained using the Illumina Mouse WG 6.1 array, and the data sets were interrogated using a weighted gene co-expression network analysis (WGCNA).
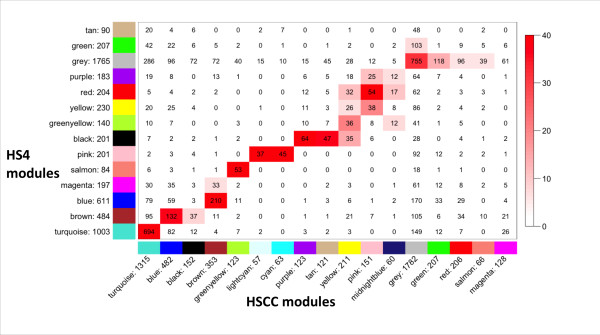
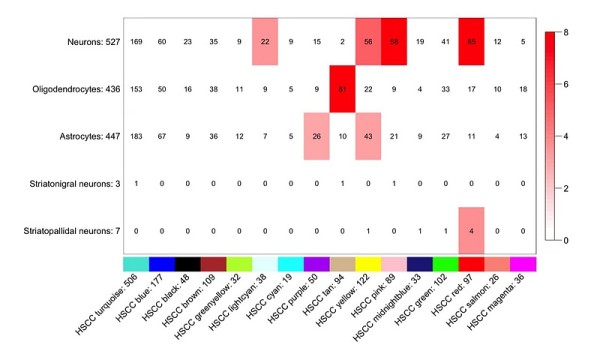
Results: Genes reliably detected as expressed were similar in all three data sets as was the variability of expression. As measured by the WGCNA, the modular structure of the transcriptome networks was also preserved both on the basis of module assignment and from the perspective of the topological overlap maps. Details of the HS-CC gene modules are provided; essentially identical results were obtained for the HS4 and F2 modules. Gene ontology annotation of the modules revealed a significant overrepresentation in some modules for neuronal processes, e.g., central nervous system development. Integration with known protein-protein interactions data indicated significant enrichment among co-expressed genes. We also noted significant overlap with markers of central nervous system cell types (neurons, oligodendrocytes and astrocytes). Using the Allen Brain Atlas, we found evidence of spatial co-localization within the striatum for several modules. Finally, for some modules it was possible to detect an enrichment of transcription binding sites. The binding site for Wt1, which is associated with neurodegeneration, was the most significantly overrepresented.
Conclusions: Despite the marked differences in genetic diversity, the transcriptome structure was remarkably similar for the F2, HS4 and HS-CC. These data suggest that it should be possible to integrate network data from simple and complex crosses. A careful examination of the HS-CC transcriptome revealed the expected structure for striatal gene expression. Importantly, we demonstrate the integration of anatomical and network expression data.
Figures


Similar articles
-
Differential network analysis reveals genetic effects on catalepsy modules.PLoS One. 2013;8(3):e58951. doi: 10.1371/journal.pone.0058951. Epub 2013 Mar 21. PLoS One. 2013. PMID: 23555609 Free PMC article.
-
Effects of selection for ethanol preference on gene expression in the nucleus accumbens of HS-CC mice.Genes Brain Behav. 2017 Apr;16(4):462-471. doi: 10.1111/gbb.12367. Epub 2017 Feb 9. Genes Brain Behav. 2017. PMID: 28058793 Free PMC article.
-
RNA sequencing profiling of the retina in C57BL/6J and DBA/2J mice: Enhancing the retinal microarray data sets from GeneNetwork.Mol Vis. 2019 Jul 5;25:345-358. eCollection 2019. Mol Vis. 2019. PMID: 31354228 Free PMC article.
-
The collaborative cross: a recombinant inbred mouse population for the systems genetic era.ILAR J. 2011;52(1):24-31. doi: 10.1093/ilar.52.1.24. ILAR J. 2011. PMID: 21411855 Review.
-
Genetic dissection of gene regulation in multiple mouse tissues.Mamm Genome. 2006 Jun;17(6):490-5. doi: 10.1007/s00335-005-0186-9. Epub 2006 Jun 12. Mamm Genome. 2006. PMID: 16783630 Review.
Cited by
-
Genes, behavior and next-generation RNA sequencing.Genes Brain Behav. 2013 Feb;12(1):1-12. doi: 10.1111/gbb.12007. Epub 2012 Dec 28. Genes Brain Behav. 2013. PMID: 23194347 Free PMC article. Review.
-
Regional Differences and Similarities in the Brain Transcriptome for Mice Selected for Ethanol Preference From HS-CC Founders.Front Genet. 2018 Aug 28;9:300. doi: 10.3389/fgene.2018.00300. eCollection 2018. Front Genet. 2018. PMID: 30210525 Free PMC article.
-
On the Use of Heterogeneous Stock Mice to Map Transcriptomes Associated With Excessive Ethanol Consumption.Front Psychiatry. 2021 Oct 12;12:725819. doi: 10.3389/fpsyt.2021.725819. eCollection 2021. Front Psychiatry. 2021. PMID: 34712155 Free PMC article. Review.
-
Evaluating gene expression in C57BL/6J and DBA/2J mouse striatum using RNA-Seq and microarrays.PLoS One. 2011 Mar 24;6(3):e17820. doi: 10.1371/journal.pone.0017820. PLoS One. 2011. PMID: 21455293 Free PMC article.
-
Common DNA methylation alterations of Alzheimer's disease and aging in peripheral whole blood.Oncotarget. 2016 Apr 12;7(15):19089-98. doi: 10.18632/oncotarget.7862. Oncotarget. 2016. PMID: 26943045 Free PMC article.
References
Publication types
MeSH terms
Substances
Grants and funding
LinkOut - more resources
Full Text Sources
Molecular Biology Databases
Research Materials
Miscellaneous
