. 2010 Nov 2;107(44):19032-7.
doi: 10.1073/pnas.1014070107. Epub 2010 Oct 18.

Push-and-pull regulation of the fusion pore by synaptotagmin-7

Affiliations

Push-and-pull regulation of the fusion pore by synaptotagmin-7

Margarita Segovia et al. Proc Natl Acad Sci U S A. .

Abstract

In chromaffin cells, Ca(2+) binding to synaptotagmin-1 and -7 triggers exocytosis by promoting fusion pore opening and fusion pore expansion. Synaptotagmins contain two C2 domains that both bind Ca(2+) and contribute to exocytosis; however, it remains unknown whether the C2 domains act similarly or differentially to promote opening and expansion of fusion pores. Here, we use patch amperometry measurements in WT and synaptotagmin-7-mutant chromaffin cells to analyze the role of Ca(2+) binding to the two synaptotagmin-7 C2 domains in exocytosis. We show that, surprisingly, Ca(2+) binding to the C2A domain suffices to trigger fusion pore opening but that the resulting fusion pores are unstable and collapse, causing a dramatic increase in kiss-and-run fusion events. Thus, synaptotagmin-7 controls fusion pore dynamics during exocytosis via a push-and-pull mechanism in which Ca(2+) binding to both C2 domains promotes fusion pore opening, but the C2B domain is selectively essential for continuous expansion of an otherwise unstable fusion pore.


Conflict of interest statement

The authors declare no conflict of interest.

Figures

Fig. 1.
Fig. 1.
Conventional amperometry reveals a decrease in Ca2+-triggered exocytosis in Syt7 KO and Syt7* KI chromaffin cells. (AC) Representative traces of bursts of amperometric spikes in WT (A), Syt7 KO (B), and Syt7* KI chromaffin cells (C). Spikes were triggered by consecutive puffs of 70 mM K+ from an adjacent pipette. (D) Integral of amperometric responses during successive stimulations. Notice that Syt7 KO and KI produced a smaller response for all stimuli in the series. Catecholamine release is decreased approximately twofold in Syt7 KO and Syt7* KI chromaffin cells as compared with WT cells (P = 0.036 and P = 0.032, respectively). (E) Number of amperometric spikes during successive stimulations. Syt7* KI cells produced a larger number of spikes per stimulation than the Syt-7 KO (P = 0.0024) and the WT (P = 0.021) cells. (F and G) Kinetic parameters of amperometric spikes in WT, Syt7 KO, and Syt7* KI chromaffin cells. (F) Spike half-widths, measured per individual amperometric spikes, were similar in WT and Syt7 KO cells but were significantly smaller in the Syt7* KI than in WT cells (**P = 0.00048) or the Syt7 KO (*P = 0.00016). (G) Spike charge was significantly different in WT and Syt7* KI cells (**P = 0.00005) and in Syt7 KO and Syt7* KI cells (*P = 0.03).
Fig. 2.
Fig. 2.
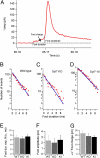
Analysis of amperometric feet events suggest normal fusion-pore opening in Syt7 KO and Syt7* KI chromaffin cells. (A) Representative trace of an amperometric spike induced by a puff of 70 mM K+ to illustrate analysis of amperometric feet. Foot onset was detected when the amperometric signal exceeded noise by 3 SD. Foot duration was calculated from the point of foot onset to the point of spike initiation obtained by extrapolating the upstroke of the spike to the baseline. (BD) Foot durations, determined by the onset of amperometric signals that exceeded noise by 3 SD, and the initiation of the amperometric spike, determined by extrapolating the upstroke of the spike to the baseline, in WT (B), Syt7 KO (C), and Syt7* KI (D) chromaffin cells. Durations of Individual feet were plotted on a semilogarithmic scale and fitted to a straight line to determine the time constant of the dwell-time distribution of feet events shown in the graph. (EG) Average fitted time-constant values in different cells of foot duration (E), foot amplitudes (F), and foot charge (G). In this parameter, no significant differences were observed in WT (n = 29), Syt7 KO (n = 16), and Syt7 KI (n = 36) cells.
Fig. 3.
Fig. 3.
Patch amperometry of single full-fusion exocytotic events in Syt7 mutants. (A) Patch amperometry configuration. On-cell patch clamping is achieved with a pipette containing a CFE. The cell membrane capacitance can be measured with a resolution that detects fusion of a single chromaffin granule with the membrane patch. Release of catecholamines into the patch pipette by spontaneous exocytotic events is measured electrochemically with the CFE. Catecholamine release occurring over the rest of the cell surface is not detected. (B) (Upper) Representative traces (example depicts a WT cell) showing simultaneous measurements of step increase in capacitance (blue trace) and of amperometric spike (red trace). (Lower) In the expanded exocytotic event, notice the delay between the onset of the capacitance and amperometric increase. (C) The size of the capacitance steps induced by exocytosis of individual chromaffin granules was similar for WT, Syt7 KO, and Syt7* KI cells (P > 0.05). (D) The charge in individual amperometric spikes associated with full-fusion events as detected by capacitance was similar for WT (3.2 ± 0.5 pC) and Syt7 KO cells (3.8 ± 0.4 pC, P > 0.05) but decreased slightly in Syt7* KI cells (2.7 ± 0.3 pC) compared with Syt7 KO cells, consistent with the reduced charge measured in Syt7* KI cells by conventional extracellular amperometry.
Fig. 4.
Fig. 4.
Syt7 KO and KI do not alter Gp but impair fusion pore expansion. (A and B) Calculation of Gp in full-fusion events for a WT cell (A) and a synaptotagmin C2B-domain KI cell (B). From the imaginary (Im; blue) and real (Re; green) components of the admittance, we calculated the time course of Gp (orange). The amperometric trace is shown in red. The amperometric spike starts before the fusion pore is fully expanded. (CH) Dwell-time distribution of fusion-pore expansion (C, E, and G) and frequency distribution of Gp values during fusion-pore expansion of full-fusion events (D, F, and H) from WT (C and D), Syt7 KO (E and F), and Syt7* KI cells (G and H). Dwell-time distributions were fitted to a single exponential (WT, τ = 52.6 ms; Syt7 KO, τ = 117.6 ms; Syt7* KI, τ = 106.4 ms; P < 0.01). For the frequency distribution of Gp values, the histogram was fitted to two Gaussian distributions for WT (fitted means ± SD values were 241 ± 105 pS and 724 ± 343 pS; Gp grows continuously to immeasurable values, i.e., >3 nS) and Syt7 KO cells (302 ± 151 pS and 764 ± 283 pS) and to three distributions for Syt7* KI cells (211 ± 166 pS, 806 ± 266 pS, and 1745 ± 593 pS). The third peak in the C2B-domain KI cells indicates that the fusion pore maintains this conductance before full expansion. (I) The average pore duration for WT was shorter than for Syt-7 KO (**P = 0.0002) and Syt7* KI (*P = 0.018), further corroborating that fusion-pore expansion is slower in mutant animals. (J) Superposition of normalized fits to Gp histograms shown in D, F, and H. The histograms are quite similar, except for a higher incidence of larger conductance values in Syt7* KI cells.
Fig. 5.
Fig. 5.
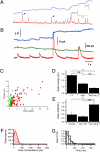
Patch amperometry of fusion-pore expansion: full collapse of fused vesicles vs. kiss-and-run fusion. (A and B) Spontaneous release events as detected by cell-membrane capacitance and amperometry in Syt7* KI chromaffin cells. Traces show step changes in capacitance (blue) and conductance (green) resulting from the fusion of a single chromaffin granule with the plasma membrane. Amperometric spikes (red) coincide with the step changes in capacitance (arrows in A). Smaller amperometric spikes can be seen between capacitance steps (asterisks in A). The first seconds of the recording shown in A are illustrated in an expanded time scale in B. In some of these spikes, we observed a transient increase in the capacitance and conductance traces, consistent with a flickering fusion event. (C) Relationship between amperometric spike charge and vesicle volume as calculated from the change in capacitance. Dots represent step changes in capacitance; triangles represent the capacitance increase during transient fusion events. Some spikes did not show any change in capacitance (triangles over zero volume). (D) Amperometric charge during full-fusion (FF) and kiss-and-run (K&R) events as determined in Syt7* KI cells. Kiss-and-run events with an observable change in capacitance had a significantly smaller charge than full-fusion events. Smaller amounts of catecholamines were released in kiss-and-run events with no observable change in capacitance (K&R no C) than in full-fusion events. Kiss-and-run events with no change in capacitance had a significantly smaller amperometric charge than kiss-and-run events in which we could detect a change in capacitance, further indicating partial release during kiss-and-run events. *P < 0.0001; **P = 0.002. (E) Ratio of kiss-and-run and full-fusion events for WT, Syt7 KO, and Syt7* KI cells. The proportion of full-fusion events decreases in Syt7* KI versus the WT and Syt7 KO cells; Kiss-and-run events increase concomitantly in Syt7* KI with respect to WT and Syt7 KO cells. *P = 0.02; **P = 0.0074. (F and G) Fusion-pore analysis for reversible fusion events in Syt7* KI cells. (F) Gp distribution is skewed to the left in reversible fusion events as compared with full-fusion events, indicating fusion pores that do not dilate during kiss-and-run events. (G) The dwell-time distribution of fusion-pore opening has a τ of 73 ms.

Similar articles

Cited by

References

    1. Del Castillo J, Stark L. The effect of calcium ions on the motor end-plate potentials. J Physiol. 1952;116:507–515. - PMC - PubMed
    1. Katz B. In: The Release of Neural Transmitter Substances. Katz B, editor. Liverpool: Liverpool Univ Press; 1969. p. 60.
    1. Sudhof TC. The synaptic vesicle cycle. Annu Rev Neurosci. 2004;27:509–547. - PubMed
    1. Geppert M, et al. Synaptotagmin I: A major Ca2+ sensor for transmitter release at a central synapse. Cell. 1994;79:717–727. - PubMed
    1. Pang ZP, Sun J, Rizo J, Maximov A, Südhof TC. Genetic analysis of synaptotagmin 2 in spontaneous and Ca2+-triggered neurotransmitter release. EMBO J. 2006;25:2039–2050. - PMC - PubMed

Publication types