. 2011 Jan;85(1):550-67.
doi: 10.1128/JVI.00254-10. Epub 2010 Oct 13.

Roles of vaccinia virus genes E3L and K3L and host genes PKR and RNase L during intratracheal infection of C57BL/6 mice

Affiliations

Roles of vaccinia virus genes E3L and K3L and host genes PKR and RNase L during intratracheal infection of C57BL/6 mice

Amanda D Rice et al. J Virol. 2011 Jan.

Abstract

The importance of the 2'-5' oligoadenylate synthetase (OAS)/RNase L and double-stranded RNA (dsRNA)-dependent protein kinase (PKR) pathways in host interferon induction resulting from virus infection in response to dsRNA has been well documented. In poxvirus infections, the interactions between the vaccinia virus (VV) genes E3L and K3L, which target RNase L and PKR, respectively, serve to prevent the induction of the dsRNA-dependent induced interferon response in cell culture. To determine the importance of these host genes in controlling VV infections, mouse single-gene knockouts of RNase L and PKR and double-knockout mice were studied following intratracheal infection with VV, VVΔK3L, or VVΔE3L. VV caused lethal disease in all mouse strains. The single-knockout animals were more susceptible than wild-type animals, while the RNase L(-/-) PKR(-/-) mice were the most susceptible. VVΔE3L infections of wild-type mice were asymptomatic, demonstrating that E3L plays a critical role in controlling the host immune response. RNase L(-/-) mice showed no disease, whereas 20% of the PKR(-/-) mice succumbed at a dose of 10(8) PFU. Lethal disease was routinely observed in RNase L(-/-) PKR(-/-) mice inoculated with 10(8) PFU of VVΔE3L, with a distinct pathology. VVΔK3L infections exhibited no differences in virulence among any of the mouse constructs, suggesting that PKR is not the exclusive target of K3L. Surprisingly, VVΔK3L did not disseminate to other tissues from the lung. Hence, the cause of death in this model is respiratory disease. These results also suggest that an unanticipated role of the K3L gene is to facilitate virus dissemination.


Figures

FIG. 1.
FIG. 1.
Survival, temperatures, and weights of mice following VV infection. Mice were infected intratracheally with VV, during which a microchip was inserted for measurement of temperature. At least 10 mice were evaluated for each time point. The overall significance of the curves (P < 0.001) was determined using Kaplan-Meier survival analysis. (A to C) C57BL/6 mice; (D to F) RNase L−/− mice; (G to I) PKR−/− mice; (J to L) RNase L−/− PKR−/− mice. Panels A, D, G, and J indicate survival curves for the mice. Panels B, E, H, and K indicate average percent weight loss based upon weight at the time of infection. Panels C, F, I, and L indicate average body temperatures. Stars denote the points at which all lethally infected mice were euthanized, and survivors were no long considered beyond those points. Diamonds, PBS; circles, 1 × 10³ PFU; squares, 1 × 10⁴ PFU; triangles, 1 × 10⁵ PFU; ×, 1 × 10⁶ PFU.
FIG. 2.
FIG. 2.
Disease progression in intratracheally infected mice. (A) Measurable clinical symptoms (weight and body temperature) are shown in boxes above the time line, while observational symptoms are depicted in boxes below the time line. (B) Photographs of infected mice at 5 days postinfection. (i) Uninfected mouse; (ii) head and face swelling with open mouth breathing; (iii) lack of grooming, typical of lethally infected mice.
FIG. 3.
FIG. 3.
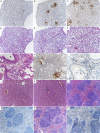
(A to I) Analysis of virus-infected cells in lung tissue over time, with arrows identifying infected bronchi. Sections are shown for day 2 (A), day 4 (B), and day 6 (C) postinfection. Magnification, ×5. H&E staining of lung tissue over time is shown for day 2 (D), day 4 (E), and day 6 (F) postinfection. Magnification, ×5. (G) H&E-stained infected bronchus and nearby blood vessel, with cells and fluid entering the surrounding tissues. Magnification, ×40. B, infected bronchus; V, position of a blood vessel; E, area of edema. (H) Infected bronchus and surrounding tissue at day 5 postinfection, showing localized infection upon IHC staining for virally infected cells. Magnification, ×10. (I) IHC staining for Ki67, showing activation of immune cells within the infected lung at day 5. (J and K) H&E staining of liver section from PBS-treated mouse (J), showing normal pathology, and from mouse at day 5 postinfection (K), showing neutrophilic areas within the liver (arrow). Magnification, ×20. (L and M) H&E staining of normal spleen (L) and Ki67 staining of normal spleen (M). (N and O) H&E staining of spleen at day 5 postinfection, showing neutrophilic and histiocytic aggregates within lymphoid follicles (N), and Ki67 staining for activation in spleen (O).
FIG. 4.
FIG. 4.
Gene profiling of virus-infected lungs. (A) Microarray analysis heat map of probes differentially expressed over time in lung tissues of infected mice, as determined by an F test performed on the data. Three samples per time point were analyzed. Each horizontal line represents a single probe expression profile. Vertical collections of lines represent the overall expression profile for a sample. Blue represents downregulation of the probe compared to the average expression value, white is the average expression value, and red is upregulation of the probe compared to the average expression value. (B) Average relative signal for 4 probe sets for STAT-1 for each time point. There was an increase of 3.5 times from day 3 to day 4 postinfection, demonstrating the significant change in the lung environment that occurred between days 3 and 4 postinfection.
FIG. 5.
FIG. 5.
Immunohistochemistry staining of STAT-1 protein in lung tissue at 5 days postinfection. Nuclei were stained with hematoxylin and appear blue; STAT-1 staining appears brown. Uninfected lung tissue (A), alveolar tissue distal from infected bronchi from an infected mouse (B), and infected bronchial regions (C) are shown. Magnification, ×40.
FIG. 6.
FIG. 6.
Survival, temperature, and weight variations following VVΔE3L infection. Mice were infected intratracheally, and at least 10 mice were evaluated for each time point. The overall significance of the curves (P < 0.001) was determined using Kaplan-Meier survival analysis. (A to C) C57BL/6 mice; (D to F) RNase L−/− mice; (G to I) PKR−/− mice; (J to L) RNase L−/− PKR−/− mice. Panels A, D, H, and J indicate survival curves for the mice. Panels B, E, H, and K indicate the average percent weight loss from the weight at the time of infection. Panels C, F, I, and L indicate average body temperatures. Stars, PBS; diamonds, 1 × 10⁴ PFU; triangles, 1 × 10⁵ PFU; ×, 1 × 10⁶ PFU; circles, 1 × 10⁷ PFU; squares, 1 × 10⁸ PFU.
FIG. 7.
FIG. 7.
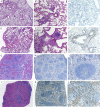
Comparative lung histology of VVΔE3L-infected mice. All mice were infected with 1 × 10⁸ PFU of virus. (A) C57BL/6 mouse lung at day 5. Magnification, ×5. (B) H&E-stained mouse lung at day 5. Magnification, ×20. (C) Day 5 lung stained for Ki67. Magnification, ×10. (D) H&E-stained PKR−/− RNase L−/− mouse lung at day 5. Magnification, ×5. (E) Same lung as in panel D. Magnification, ×20. (F) Ki67 staining of day 5 mouse lung. Magnification, ×10. (G) H&E-stained C57BL/6 mouse spleen at day 5. Magnification, ×5. (H) Ki67 staining of same spleen. Magnification, ×5. (I) Ki67 staining of same spleen. Magnification, ×20. (J) H&E-stained PKR−/− RNase L−/− mouse spleen at day 5. Magnification, ×5. (K) Ki67 staining of same spleen. Magnification, ×5. (L) Ki67 staining of same spleen. Magnification, ×20.
FIG. 8.
FIG. 8.
Survival, temperature, and weight variations following VVΔK3L infection. Mice were infected intratracheally, and at least 10 mice were evaluated for each time point. The overall significance of the curves (P < 0.001) was determined using Kaplan-Meier survival analysis. (A to C) C57BL/6 mice; (D to F) RNase L−/− mice; (G to I) PKR−/− mice; (J to L) PKR−/− RNase L−/− mice. Panels A, D, H, and J indicate survival curves for the mice. Panels B, E, H, and K indicate percent weight loss over time. Panels C, F, I, and L indicate body temperatures. Surviving C57BL/6 animals infected with 1 × 10⁶ PFU of virus were terminated at day 6. RNase L−/− or PKR−/− mice infected at 1 × 10⁵ PFU of virus were terminated at day 5, and PKR−/− RNase L−/− animals infected with 1 × 10⁵ PFU, which were all less ill than the other animals, were terminated at day 6. Stars, PBS; circles, 1 × 10³ PFU; squares, 1 × 10⁴ PFU; triangles, 1 × 10⁵ PFU; ×, 1 × 10⁶ PFU.
FIG. 9.
FIG. 9.
Comparative temperatures and weight losses for VV- and VVΔK3L-infected C57BL/6 mice. (A) Average weight losses. (B) Average body temperatures. Error bars represent standard errors of the means. Diamonds, VV-infected animals; circles, VVΔK3L-infected animals.
FIG. 10.
FIG. 10.
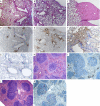
Analysis of virus spread and lung histology of mice infected with VVΔK3L at 5 days postinfection. Images are for C57BL/6 mice infected with 1 × 10⁶ PFU of virus. (A) H&E staining of lung at 3 days postinfection. Magnification, ×5. (B) H&E staining of lung at 5 days postinfection. Magnification, ×5. (C) H&E staining of lung at 5 days postinfection, showing severe edema with no virus present. Magnification, ×10. (D) Immunohistochemistry staining for virus replication (GFP) in the lung at 3 days postinfection. Magnification, ×5. (E) Immunohistochemistry staining for virus replication in the lung at 5 days postinfection. Magnification, ×5. (F) Immunohistochemistry staining for virus replication in the lung at 5 days postinfection. Magnification, ×40. (G) Ki67 staining of lung tissue at day 5 postinfection, showing active immune response at the site of infection. Magnification, ×10. (H) H&E staining of the spleen at day 3 postinfection. Magnification, ×10. (I) Ki67 staining at day 3 postinfection. Magnification, ×10. (J) H&E staining of day 5 spleen. Magnification, ×10. (K) Ki67 staining of day 5 spleen. Magnification, ×10.

Similar articles

Cited by

References

    1. Beattie, E., E. B. Kauffman, H. Martinez, M. E. Perkus, B. L. Jacobs, E. Paoletti, and J. Tartaglia. 1996. Host-range restriction of vaccinia virus E3L-specific deletion mutants. Virus Genes 12:89-94. - PubMed
    1. Beattie, E., E. Paoletti, and J. Tartaglia. 1995. Distinct patterns of IFN sensitivity observed in cells infected with vaccinia K3L− and E3L− mutant viruses. Virology 210:254-263. - PubMed
    1. Beattie, E., J. Tartaglia, and E. Paoletti. 1991. Vaccinia virus-encoded eIF-2 alpha homolog abrogates the antiviral effect of interferon. Virology 183:419-422. - PubMed
    1. Blance, R. N., A. H. Sims, E. Anderson, A. Howell, and R. B. Clarke. 2009. Normal breast tissue implanted into athymic nude mice identifies biomarkers of the effects of human pregnancy levels of estrogen. Cancer Prev. Res. (Philadelphia) 2:257-264. doi:10.1158/1940-6207.CAPR-08-0161. - DOI - PubMed
    1. Brandt, T., M. C. Heck, S. Vijaysri, G. M. Jentarra, J. M. Cameron, and B. L. Jacobs. 2005. The N-terminal domain of the vaccinia virus E3L-protein is required for neurovirulence, but not induction of a protective immune response. Virology 333:263-270. - PubMed

Publication types

MeSH terms