Meta-Analysis
. 2010 Oct 6;2(52):52ra73.
doi: 10.1126/scitranslmed.3001059.

PGC-1α, a potential therapeutic target for early intervention in Parkinson's disease

Affiliations
Meta-Analysis

PGC-1α, a potential therapeutic target for early intervention in Parkinson's disease

Bin Zheng et al. Sci Transl Med. .

Abstract

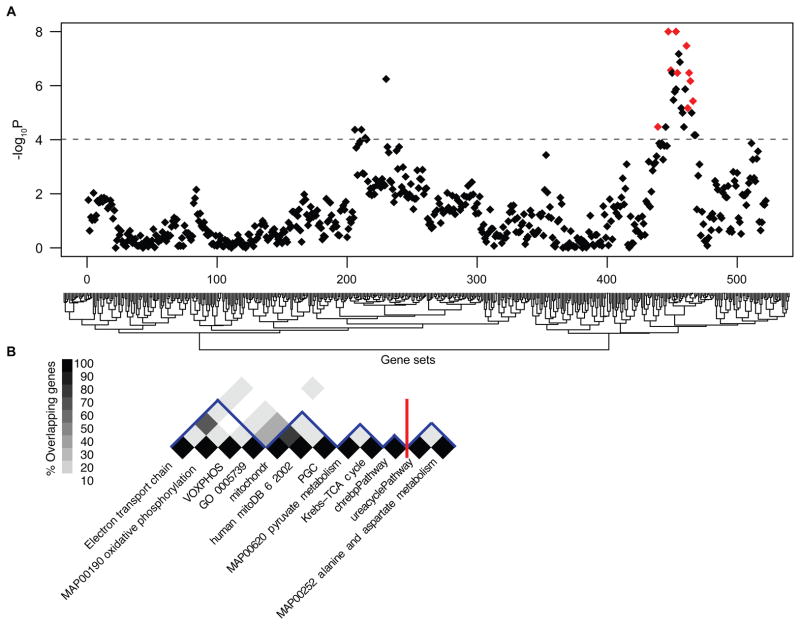
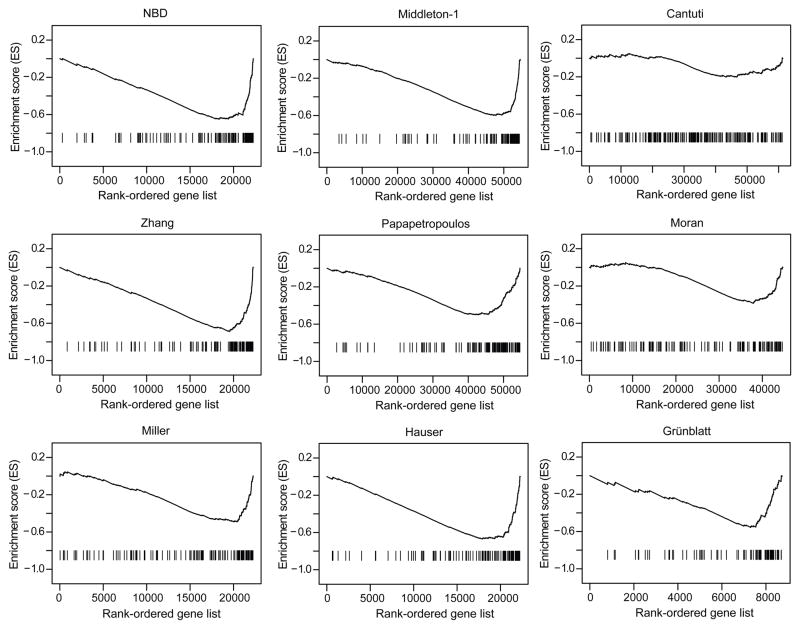
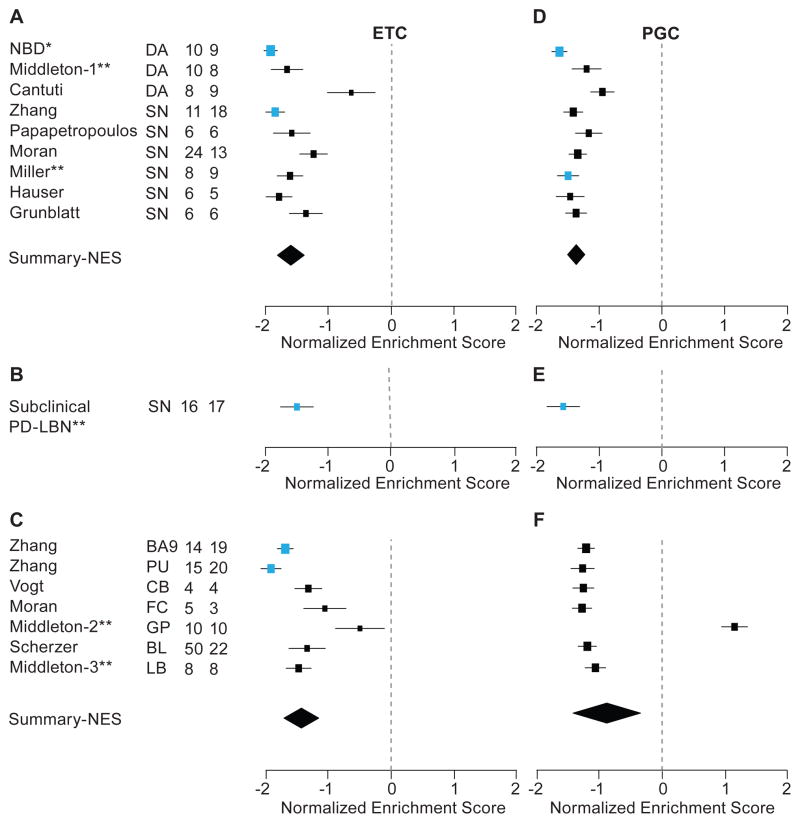
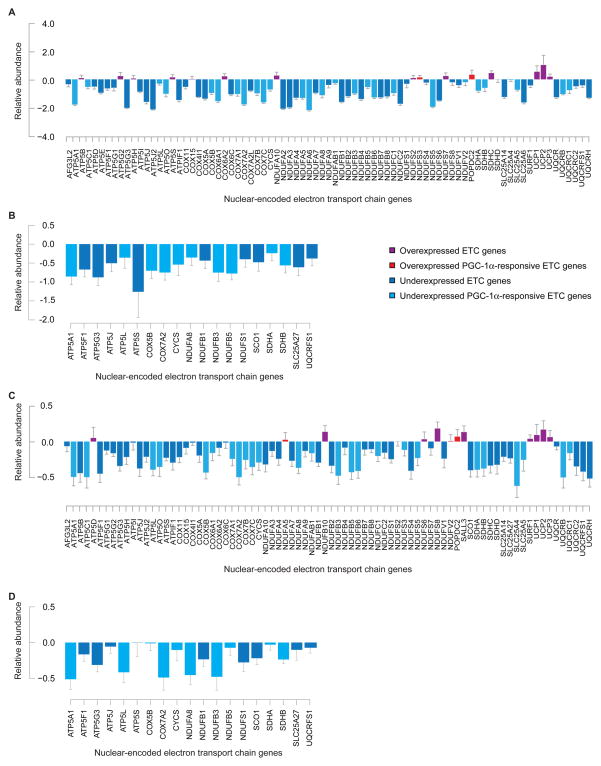
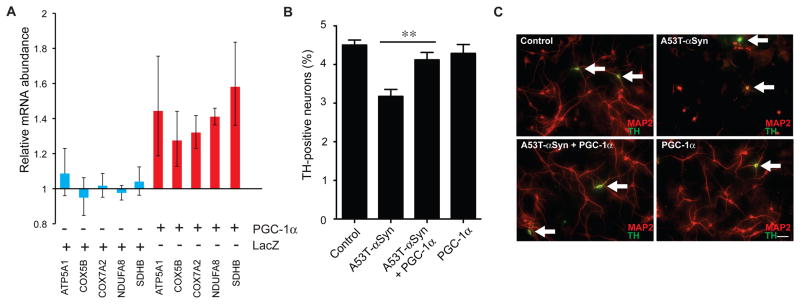
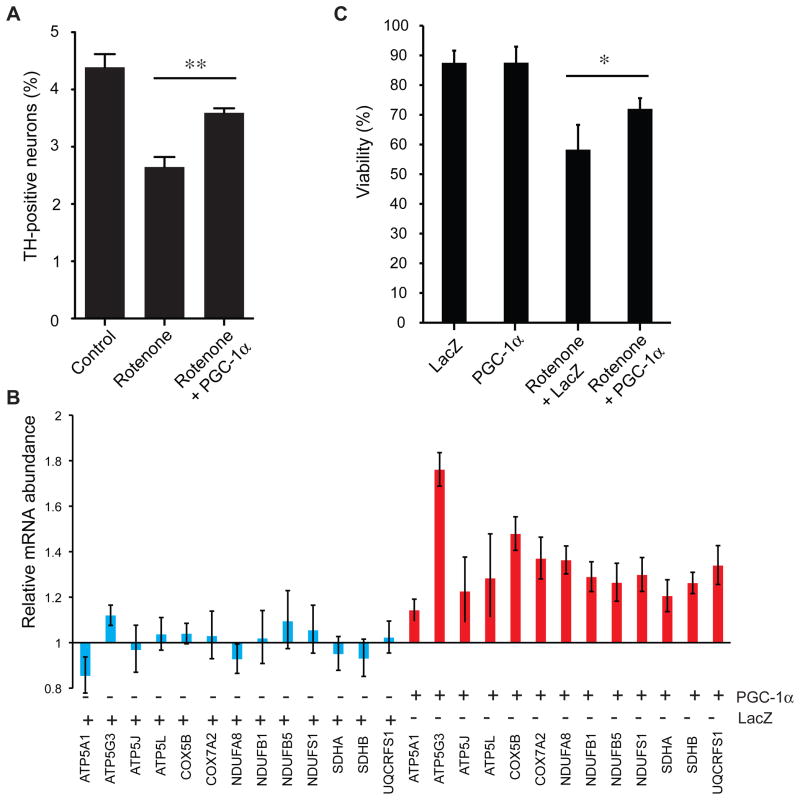
Parkinson's disease affects 5 million people worldwide, but the molecular mechanisms underlying its pathogenesis are still unclear. Here, we report a genome-wide meta-analysis of gene sets (groups of genes that encode the same biological pathway or process) in 410 samples from patients with symptomatic Parkinson's and subclinical disease and healthy controls. We analyzed 6.8 million raw data points from nine genome-wide expression studies, and 185 laser-captured human dopaminergic neuron and substantia nigra transcriptomes, followed by two-stage replication on three platforms. We found 10 gene sets with previously unknown associations with Parkinson's disease. These gene sets pinpoint defects in mitochondrial electron transport, glucose utilization, and glucose sensing and reveal that they occur early in disease pathogenesis. Genes controlling cellular bioenergetics that are expressed in response to peroxisome proliferator-activated receptor γ coactivator-1α (PGC-1α) are underexpressed in Parkinson's disease patients. Activation of PGC-1α results in increased expression of nuclear-encoded subunits of the mitochondrial respiratory chain and blocks the dopaminergic neuron loss induced by mutant α-synuclein or the pesticide rotenone in cellular disease models. Our systems biology analysis of Parkinson's disease identifies PGC-1α as a potential therapeutic target for early intervention.


Conflict of interest statement

Competing interests: S.P. holds stock in Allergan Inc. and Biogen Idec Inc. C.R.S. has received consulting fees from Link Medicine Corp. and the Michael J. Fox Foundation. He is a scientific collaborator of DiaGenic in a study entirely funded by the Michael J. Fox Foundation and has received speaking fees from the International Movement Disorders Society, as well as being listed as co-inventor on a U.S. patent held by Brigham and Women’s Hospital relating to diagnostics for neurodegenerative diseases. None of the other authors have any competing interests to declare.

Figures

Fig. 1
Fig. 1
Association between 522 molecular gene sets and PD. (A) Random-effects meta-GSEA of 522 prespecified gene sets across nine genome-wide expression studies representing 185 laser-captured dopamine neuron and substantia nigra transcriptomes. Twenty-eight gene sets were associated with PD with genome-wide significance (P values < 9.6 × 10⁻⁵, corresponding to dashed line). Negative log-transformed P values indicating the significance of each of the 522 associations are shown on the y axis. Associations with PD were confirmed for 10 of the 28 gene sets in stage 2 and 3 analyses (Table 2) and are highlighted in red in (A). The 522 gene sets interrogated are displayed on the x axis and are clustered by their effect size estimate. (B) Twelve gene sets were taken forward for replication to stages 2 and 3. These include 10 partially overlapping gene sets that were associated with PD at all three stages of analysis. The defects in cellular energetics detected by these gene sets include the distinct, but interconnected, processes of nuclear-encoded mitochondrial electron transport (ETC, MAP00190 oxidative phosphorylation, VOXPHOS, and GO 0005739), and PGC-1α–responsive mitochondrial bioenergetics (PGC, human mitoDB 6 2002, and mitochondr), glucose utilization (MAP00620 pyruvate metabolism and Krebs-TCA Cycle), and glucose sensing (ChREBP pathway). Two of the 12 gene sets forwarded across all stages, urea cycle pathway and MAP00252 alanine and aspartate metabolism, failed replication in stage 3. The percentage of genes overlapping between pairs of gene sets is color-coded on a grayscale. Gene set nomenclature and annotations correspond to version 1.1 of the MSigDB C2.
Fig. 2
Fig. 2
Enrichment plots (25) for the ETC gene set in the nine GWESs representing stage 1 of the pathway analysis. The lower portion (“barcode graph”) of each plot shows probes for the thousands of target genes rank-ordered (left to right) by their differential expression in PD compared to controls (x axis). Ranks are based on the signal-to-noise ratio metric. Probes targeting genes overexpressed in patients with PD are top-ranked (near 1; left), and probes targeting genes underexpressed in patients with PD are low-ranked (near the end of the sorted gene list; right). The vertical lines show where probes for the 95 ETC genes appear in this ranked-ordered gene list. In most barcode graphs, visual inspection indicates that ETC genes are enriched at the end (right) of each rank-ordered list, consistent with a gene set that is underexpressed in PD. By contrast, in one of the nine GWESs (Cantuti), ETC genes appear randomly distributed across the sorted gene list, indicating that the ETC gene set is not enriched in this particular study. The top portion of each plot shows the enrichment score (y axis) that is calculated by walking down the rank-ordered gene list from top- to last-ranked gene, decreasing a running-sum statistic when a gene is encountered that is not part of the ETC gene set, and increasing the score when a gene is encountered that is in the ETC gene set. Because ETC genes are underrepresented among the top ranks and enriched among the last ranks, highly negative maximal enrichment scores (distinct valleys) are achieved for ETC in most GWESs, consistent with a coordinated underexpression of the ETC pathway in PD.
Fig. 3
Fig. 3
(A to C) Forrest plots of NES estimates (± SD) for the ETC gene set. To account for the size of each gene set, we normalized enrichment scores yielding the NES. The data are presented separately for each of the 17 studies. Blue squares, association (P ≤ 0.05) in an individual study; black squares, association (P > 0.05) in an individual study. The size of a square is inversely proportional to its respective SD. The summary estimate is indicated by a diamond; the width of the diamond is proportional to the 95% confidence interval of the sNES. **,previously unpublished studies; *,study unpublished at the time of analysis and since reported in (24). (A) NES estimates for the ETC gene set in nine substantia nigra and laser-captured dopamine neuron GWESs representing a total of 185 transcriptomes (99 arrays from cases and 86 arrays from controls). Note that the third laser-captured dopamine neuron (DA) data set (Cantuti) is a technical outlier (see fig. S1). (B) NES estimates for the ETC gene set in an analysis of postmortem substantia nigra of 16 individuals with subclinical PD-related Lewy body neuropathology (PD-LBN), and 17 age-, sex-, and PMI-matched controls. (C) NES estimates for the ETC gene set in seven GWES, representing 192 extranigral transcriptomes or 106 arrays from cases and 86 from controls. These include brain regions that show abundant Lewy body pathology without appreciable neuron loss in PD, such as FC and prefrontal cortex BA9, as well as basal ganglia structures that are affected by biochemical changes in PD such as GP and PU. One data set derived from human LB cell lines and one from cellular whole blood were included. (D to F) NES estimates for the PGC-1α gene set. The data are presented separately for each of the 17 studies analyzed as above. Blue squares, association (P ≤ 0.05) in an individual study.
Fig. 4
Fig. 4
Nuclear-encoded ETC genes are coordinately underexpressed in laser-captured dopamine neurons of patients with PD and in the substantia nigra of individuals with incipient Lewy body disease. (A) Most nuclear-encoded ETC genes are underexpressed in laser-captured dopamine neurons of patients with PD. ETC genes responsive to the master transcriptional regulator PGC-1α are color-coded in light blue (underexpressed) or bright red (overexpressed). Underexpression of other ETC genes is color-coded in dark blue and overexpression in purple. Data from the NBD GWES assayed on the Affymetrix platform are shown. For genes interrogated by multiple probes, results for only one probe are visualized due to space limitations (the median probe or a representative probe for odd or even numbers of probes, respectively). (B) qPCR analysis confirms underexpression of select ETC genes in substantia nigra of patients with PD. Underexpression of ETC genes (dark blue) and a subset of PGC-1αresponsive ETC (light blue) was confirmed in 13 independent cases with PD and 17 age- and sex-matched controls by qPCR, with P = 3.8 × 10⁻⁶ and P = 0.002, respectively, by binomial test. (C) Nuclear-encoded ETC genes are underexpressed in subclinical PD-related Lewy body neuropathology (P = 0.015). Expression changes were assayed on the Illumina platform. Select genes are interrogated by multiple probes. Note different scales in A and C. (D) qPCR analysis confirms underexpression of select ETC genes in subclinical PD-related Lewy body neuropathology. Underexpression of ETC genes (dark blue) and a subset of PGC-1αresponsive ETC (light blue) was confirmed in subclinical PD-related Lewy body neuropathology by qPCR, with P = 3.8 × 10⁻⁶ and P = 0.002, respectively, by binomial test.
Fig. 5
Fig. 5. PGC-1α coactivates nuclear-encoded electron transport genes and blocks α-synuclein–induced degeneration of dopaminergic neurons in rat primary midbrain cultures
(A) Cotransduction with adenovirus carrying human PGC-1α activated the expression of endogenous genes encoding nuclear subunits of the mitochondrial respiratory chain complexes I, II, IV, and V in rat midbrain primary neurons overexpressing A53T-α-synuclein (red bars). By contrast, transduction with the control gene LacZ did not materially affect expression of these genes in A53T–α-synuclein–expressing primary neurons (blue bars). The ribosomal gene RPL13 was used to control for input RNA. Midbrain cultures transduced with A53T-α-synuclein alone were used as calibrator. Mean ± SEM are shown (N = 3 for each treatment). (B) Human PGC-1α rescues preferential loss of TH-positive neurons induced by A53T–α-synuclein overexpression in rat midbrain primary cultures. Primary rat embryonic midbrain cultures were either mock infected (control) or transduced with adenovirus encoding A53T–α-synuclein alone, or both A53T–α-synuclein plus PGC-1α, or PGC-1α alone. Selective loss of dopamine neurons was assessed immunocytochemically by determining the percentage of MAP2-positive neurons that also stained positive for TH. **P < 0.01 by one-way analysis of variance (ANOVA) with Newman-Keuls post-hoc test. Mean ± SEM are shown (N = 3 for all treatments). (C) PGC-1α overexpression antagonized α-synuclein–induced dopaminergic neuron loss and abrogated the A53T–α-synuclein–mediated retraction of MAP2- and TH-positive neuronal processes. Arrows, dopaminergic neurons positive for both MAP2 (red) and TH (green). Scale bar, 40 μm.
Figure 6
Figure 6. PGC-1α suppresses loss of primary dopamine neurons and up-regulates nuclear subunits and viability in cellular models of rotenone toxicity
(A) Transduction with adenovirus encoding human PGC-1α suppressed loss of TH-positive neurons induced by exposure to rotenone (100 nM) in primary mesencephalic cultures. **P < 0.01 by one-way ANOVA with Newman-Keuls post-hoc test. Mean ± SEM are shown (N = 4 for all treatments). (B) PGC-1α over-expression in human catecholaminergic SH-SY5Y cells treated with rotenone (10 μM) coactivated the expression of nuclear-encoded subunits of complex I to V of the mitochondrial ETC (red bars) compared to gene expression in rotenone-treated cells transduced with the control gene LacZ (blue bars). The ribosomal gene RPL13 was used to control for input RNA; untransfected cells treated with rotenone alone were used as calibrator. Mean ± SEM are shown (N = 3 to 4 for all treatments). (C) Overexpression of PGC-1α compared to the control gene LacZ induced a small but statistically significant 14% increase in viability of human catecholaminergic SH-SY5Y cells treated with rotenone (10 μM) as estimated by the MTT assay. Percentage cell viability compared to untreated control cells is shown. *P = 0.02 by two-sided t test. Mean ± SEM are shown (N = 8 for all treatments).

Similar articles

Cited by

References

    1. Dhillon AS, Tarbutton GL, Levin JL, Plotkin GM, Lowry LK, Nalbone JT, Shepherd S. Pesticide/environmental exposures and Parkinson’s disease in East Texas. J Agromedicine. 2008;13:37. - PubMed
    1. Chade AR, Kasten M, Tanner CM. Nongenetic causes of Parkinson’s disease. J Neural Transm. 2006;(Suppl):147. - PubMed
    1. Sherer TB, Betarbet R, Testa CM, Seo BB, Richardson JR, Kim JH, Miller GW, Yagi T, Matsuno-Yagi A, Greenamyre JT. Mechanism of toxicity in rotenone models of Parkinson’s disease. J Neurosci. 2003 Nov 26;23:10756. - PMC - PubMed
    1. Park HJ, Kim HJ, Park HK, Chung JH. Protective effect of histamine H2 receptor antagonist ranitidine against rotenone-induced apoptosis. Neurotoxicology. 2009 Nov;30:1114. - PubMed
    1. Betarbet R, Sherer TB, MacKenzie G, Garcia-Osuna M, Panov AV, Greenamyre JT. Chronic systemic pesticide exposure reproduces features of Parkinson’s disease. Nat Neurosci. 2000 Dec;3:1301. - PubMed

Publication types

MeSH terms

Substances