. 2010 Nov 15;185(10):5704-13.
doi: 10.4049/jimmunol.1000690. Epub 2010 Oct 6.

IL-2 and IL-4 stimulate MEK1 expression and contribute to T cell resistance against suppression by TGF-beta and IL-10 in asthma

Affiliations

IL-2 and IL-4 stimulate MEK1 expression and contribute to T cell resistance against suppression by TGF-beta and IL-10 in asthma

Qiaoling Liang et al. J Immunol. .

Abstract

The T cell-driven airway inflammation in chronic asthma is uninhibited and sustained. We examined the resistance of T cells from asthmatic patients against suppression by TGF-β, IL-10 and glucocorticoids and explored its signaling mechanism. CD4(+)CD25(-) T cells from allergic asthmatic subjects demonstrated increased TCR-stimulated proliferation as compared with healthy and chronic obstructive pulmonary disease controls. This proliferation was resistant to inhibition by TGF-β, IL-10, and dexamethasone and to anergy induction. CD4 T cells from asthmatic patients, but not chronic obstructive pulmonary disease, allergic rhinitis, and healthy subjects, showed increased expression of MEK1, heightened phosphorylation of ERK1/2, and increased levels of c-Fos. IL-2 and IL-4 stimulated the expression of MEK1 and c-Fos and induced T cell resistance. The inhibition of MEK1 reversed, whereas induced expression of c-Fos and JunB promoted T cell resistance against TGF-β- and IL-10-mediated suppression. We have uncovered an IL-2- and IL-4-driven MEK1 induction mechanism that results in heightened ERK1/2 activation in asthmatic T cells and make them resistant to certain inhibitory mechanisms.


Figures
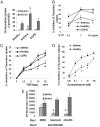
FIGURE 1
FIGURE 1
A, Proliferation of T cells. CD4+CD25 T cells from 20 allergic asthmatic patients, 20 healthy controls, and 10 COPD patients were cultured alone or in the presence of anti-CD3 and anti-CD28 Abs for 72 h. [3H]Thymidine incorporation was measured in the last 16 h of culture. p = 0.001 (Kruskal Wallis ANOVA). Asterisks indicate statistical significance (*p < 0.01, Tukey HSD test) compared with the healthy controls. B, T cell response to IL-10–mediated inhibition. CD4+CD25 T cells from allergic asthmatic (n = 10) and COPD (n = 6) patients and normal subjects (n = 10) were stimulated with anti-CD3/CD28 Abs in the presence of IL-10 and then cultured for [3H]thymidine incorporation as above. p = 0.0001 (Kruskal-Wallis ANOVA). *p < 0.05 compared with healthy and COPD (Tukey-Kramer test). C, T cell response to TGF-β–mediated inhibition. CD4+CD25 T cells from allergic asthmatic and normal subjects were stimulated with anti-CD3/CD28 Abs and cultured in the presence of TGF-β. [3H]Thymidine incorporation was measured at 72 h (n = 10 for asthma and healthy control; n = 6 for COPD). p = 0.0002 (Kruskal-Wallis ANOVA); *p < 0.05 (Tukey-Kramer test). D, T cell response to dexamethasone. CD4 T cells from allergic asthmatic patients and healthy controls (n = 6 for each group) were stimulated with anti-CD3/CD28 in the presence of dexamethasone. [3H]Thymidine uptake in the last 16 h of a 72-h culture period was measured. p = 0.00001 (Kruskal-Wallis ANOVA); *p < 0.05 (Tukey-Kramer test). E, T cell response to anergy induction. CD4 T cells were cultured overnight with ionomycin (10 μM) or anti-CD3 Ab (5 μg/ml) and then washed and stimulated with anti-CD3/CD28 (5 μg/ml each). [3H]Thymidine uptake was measured as above. n = 8. *p < 0.01 compared with DMSO-treated healthy control T cells (Mann–Whitney U test).
FIGURE 2
FIGURE 2
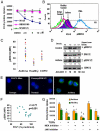
Expression of p-ERK1/2 in CD4 T cells. A, Effect of MAPK inhibitor on T cell proliferation. CD4 T cells from healthy donors were stimulated with anti-CD3/CD28 Abs in the presence of the MEK1/2 inhibitor U0126, the p38 inhibitor SB202190, and the JNK inhibitor SP600125, and [3H]Thymidine uptake was measured at 72 h. *p = 0.04; **p = 0.03 compared with DMSO. B, Blood CD4 T cells were stained with mouse mAb against the phosphorylated (activating phosphorylation) form of ERK1/2 (p-ERK1/2) or mouse IgG1 isotype control, followed by an Alexa 488-labeled anti-mouse secondary Ab. One sample of CD4 T cells was stimulated with PMA prestaining (positive control). A representative flow cytogram is shown. y-axis, Cell counts at each level of fluorescence intensity; x-axis, Fluorescence intensity. C, p-ERK1/2 immunostaining of purified CD4 T cells as described above from 20 allergic asthmatic patients, 10 healthy, and 10 COPD controls. Each symbol represents a single study subject, and the same color indicates paired samples. Data are presented as geometric MFI. p < 0.0001 (Kruskal-Wallis ANOVA); *p < 0.01 asthma versus other groups, and COPD versus allergy and healthy (Tukey HSD test). D, Western blotting of CD4 T cells for p-ERK1/2 following stimulation of the cells with anti-CD3/CD28 (n = 3). The membranes were reprobed for ERK1/2 as a loading control. Density of the bands was measured by the National Institutes of Health Image J software (Bethesda, MD). E, Immunofluorescent staining of CD4 T cells from an allergic asthmatic patient and healthy control for basal expression of p-ERK1/2 (green) and nuclear counterstaining with DAPI (blue) (n = 3). Original magnification ×100. F, Correlation between p-ERK1/2 and FEV1. G, Effect of signaling inhibitors on TGF-β–induced inhibition of T cell proliferation. CD4+ T cells were stimulated with anti-CD3/CD28 in the presence or absence of TGF-β. U0126 or SP600125 was added to the indicated cultures at 5 μM concentration. [3H]Thymidine uptake during the last 16 h of culture was measured (n = 5). p values (paired t test) for the difference are as follows: 1, 0.02; 2, 0.01 (both were compared with the TGF-β and inhibitor samples); 3, 0.01 compared with the TGF-β+ and MEK inhibitor+ samples; 4, 0.1 compared with the TGF-β+ sample and 0.01 compared with the MEK inhibitor+ sample.
FIGURE 3
FIGURE 3
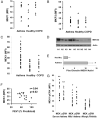
Expression of MAPK regulators in T cells. AC, Flow cytometric analyses of the expression of MKP1, MKP3, and MEK1. Purified CD4 T cells from the indicated study groups were stained for MKP1, MKP3, and MEK1 with Alexa 488-labeled Abs. A, n = 9, 6, and 6 for asthma, healthy, and COPD, respectively. B, n = 11, 9, and 6 for asthma, healthy, and COPD, respectively. C, n = 29, 22, and 10 for asthma, healthy, and COPD, respectively. Each symbol represents a single study subject. p = 0.0001 (Kruskal-Wallis ANOVA). *p < 0.01 asthma versus healthy and COPD (Tukey HSD test). D, Western blotting for MEK1 expression. Purified CD4 T cells from five randomly selected allergic asthmatic (A1–5) patients and four healthy normal (N1–4) controls were Western blotted for MEK1. The membrane was reprobed for actin to demonstrate protein loading. E, Densitometric analysis of MEK1 expression in the Western blot membrane from D. *p = 0.001 (Mann–Whitney U test). F, Correlation between the T cell MEK1 level and FEV1 in asthmatic patients (Spearman’s rank correlation test). G, Comparison of MEK1 and p-ERK1/2 expression among severe and mild asthmatic patients (ATS criteria, see Ref. 22) and allergic rhinitis patients without asthma. p < 0.0001 Kruskal-Wallis ANOVA; *p < 0.05 compared with the corresponding data from the allergic rhinitis group (Tukey-Kramer test); **p < 0.05 compared with the corresponding data from the mild asthma and allergic rhinitis groups.
FIGURE 4
FIGURE 4
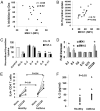
A, Correlation between T cell MEK1 expression and dexamethasone inhibition of T cell proliferation. B, Correlation between MEK1 expression and CD4 T cell proliferation in response to anti-CD3/CD28 Abs. The r and p values were analyzed by the Spearman’s rank correlation test. C, Role of cytokines in T cell resistance against cytokines. CD4+ T cells from healthy controls were cultured without (control, open white bars) or with IL-10 or TGF-β in the absence (No IL) or presence of IL-2, IL-4, IL-6, IL-9, and IL-13 (10 ng/ml). All samples were stimulated with anti-CD3/CD28 Abs and [3H]thymidine uptake was measured at 72 h (n = 5). *p < 0.01. D, Role of cytokines in MEK1 expression. Mononuclear cells from asthmatic subjects were cultured alone (medium) or with IL-2, IL4, IL-6, IL-12, IL-25 (all at 10 ng/ml), and anti-CD3/CD28 Abs (5 μg/ml) for 48 h. MEK1 expression was assessed by flow cytometry following double staining for CD4 and MEK1. *p < 0.01 (n = 6, paired t test). E and F, The production of IL-2 and IL-4 by CD4 T cells. E, Intracellular IL4+ CD4 T cells were measured by flow cytometry after stimulation with and without CD3/CD28 Abs. F, IL-2 production in the stimulated CD4 T cell culture supernatant was measured by ELISA.
FIGURE 5
FIGURE 5
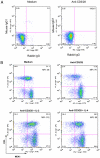
MEK1 induction by cytokine and TCR stimulation. Mononuclear cells from an asthmatic subject were cultured alone (medium) or stimulated with anti-CD3 and CD28 Abs with or without IL-2 or IL-4 (10 ng/ml) for 48 h. MEK1 expression was assessed by double staining for CD4 and MEK1. A, Isotype control Ab staining of mononuclear cells. Cultured mononuclear cells were stained with mouse IgG1 (control for p-ERK1/2) and rabbit IgG (control for MEK1). Note that anti-CD3/CD28 stimulation (right panel) shifted the cell population slightly to the right likely due to the increased cell size. The gate was adjusted in all anti-CD3/CD28-treated samples (B) to reflect this change. B, MEK1 expression in CD4 T cells upon culture with medium, anti-CD3/CD28, anti-CD3/CD28 + IL-2, and anti-CD3/CD28 + IL-4. The number in the quadrant represents percent of the total cells. The bottom number in the upper right quadrant represents geometric mean of fluorescence intensity.
FIGURE 6
FIGURE 6
A, Effect of MEK1/2 inhibition on select AP-1 transcription factors. CD4 T cells from a healthy control were cultured with anti-CD3/CD28 in the presence of U0126 or vehicle (DMSO) and then Western blotted for the expression of c-Jun, JunB, and c-Fos at 4 h and JunD at 24 h. The JunB membrane was reprobed for tubulin to demonstrate protein loading (n = 3). B, Effect of IL-4 on c-Fos and JunB expression. CD4 T cells from an asthmatic donor was stimulated with an anti-CD3 Ab, IL-4, or in combination for 4 h and then Western blotted for JunB or c-Fos (n = 3). The JunB membrane was reprobed for tubulin. C, Coexpression of p-ERK1/2 and JunB. CD4 T cells from an asthmatic donor were stimulated with an anti-CD3 Ab for 42 h and then processed for double immunostaining using a mouse monoclonal anti–p-ERK1/2 and rabbit anti-JunB Ab. Species- and isotype-specific secondary Abs were labeled with Alexa 549 (red) and Alexa 488 (green), respectively. Nuclei were stained blue with DAPI (n = 3). D, Control immunostaining with rabbit IgG. Isotype control immunostaining for the mouse monoclonal anti–p-ERK1/2 Ab is shown in Fig. 2E. C and D, Original magnification ×100.
FIGURE 7
FIGURE 7
Effect of c-Fos and JunB overexpression. A and B, Expression of c-Fos in T cells from asthma. Purified CD4 T cells from allergic asthmatic patients and control subjects (n = 6) were stained for c-Fos and analyzed by flow cytometry (A). Each symbol represents a single donor. Cell lysates from select donors were Western blotted for c-Fos (B) (n = 3). C and D, Overexpression of c-Fos and JunB. CD4 T cells from a healthy donor were infected with a GFP (RV), GFP-cFos (Fos), or GFP-JunB (JunB)-expressing bicistronic RV. GFP-expressing cells were sorted and Western blotted for expression of c-Fos (C) and JunB (D). JunB-expressing cells were also stimulated with anti-CD3 and anti-CD28 Abs to determine the effect of stimulation. The membrane was reprobed for actin to demonstrate protein loading (n = 3). Effect of c-Fos and JunB overexpression on proliferation (E) and IL-10– (F) and TGF-β–mediated (G) inhibition of proliferation. Infected and sorted CD4 T cells from healthy donors (as described above) were cultured with anti-CD3/28 Abs, and [3H]thymidine uptake was measured at 72 h (E). *p < 0.02 (paired t test); n = 3. F, Infected and sorted CD4 T cells were cultured as per the IL-10–mediated suppression protocol. *p = 0.04 (t test); n = 3. G, Infected and sorted CD4 T cells were cultured as per the TGF-β–mediated suppression assay protocol (n = 3). *p = 0.01 (t test); n = 4.

Similar articles

Cited by

References

    1. Robinson DS, Hamid Q, Jacobson M, Ying S, Kay AB, Durham SR. Evidence for Th2-type T helper cell control of allergic disease in vivo. Springer Semin. Immunopathol. 1993;15:17–27. - PubMed
    1. Robinson D, Hamid Q, Bentley A, Ying S, Kay AB, Durham SR. Activation of CD4+ T cells, increased TH2-type cytokine mRNA expression, and eosinophil recruitment in bronchoalveolar lavage after allergen inhalation challenge in patients with atopic asthma. J. Allergy Clin. Immunol. 1993;92:313–324. - PubMed
    1. O’Garra A, Vieira P. Regulatory T cells and mechanisms of immune system control. Nat. Med. 2004;10:801–805. - PubMed
    1. Shevach EM. Regulatory T cells in autoimmmunity. Annu. Rev. Immunol. 2000;18:423–449. - PubMed
    1. Lewkowich IP, Herman NS, Schleifer KW, Dance MP, Chen BL, Dienger KM, Sproles AA, Shah JS, Köhl J, Belkaid Y, Wills-Karp M. CD4+CD25+ T cells protect against experimentally induced asthma and alter pulmonary dendritic cell phenotype and function. J. Exp. Med. 2005;202:1549–1561. - PMC - PubMed

Publication types

MeSH terms