Ribonucleoside triphosphates as substrate of human immunodeficiency virus type 1 reverse transcriptase in human macrophages
- PMID: 20924117
- PMCID: PMC2998149
- DOI: 10.1074/jbc.M110.178582
Ribonucleoside triphosphates as substrate of human immunodeficiency virus type 1 reverse transcriptase in human macrophages
Abstract
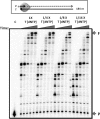
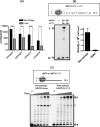
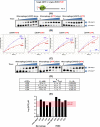
We biochemically simulated HIV-1 DNA polymerization in physiological nucleotide pools found in two HIV-1 target cell types: terminally differentiated/non-dividing macrophages and activated/dividing CD4(+) T cells. Quantitative tandem mass spectrometry shows that macrophages harbor 22-320-fold lower dNTP concentrations and a greater disparity between ribonucleoside triphosphate (rNTP) and dNTP concentrations than dividing target cells. A biochemical simulation of HIV-1 reverse transcription revealed that rNTPs are efficiently incorporated into DNA in the macrophage but not in the T cell environment. This implies that HIV-1 incorporates rNTPs during viral replication in macrophages and also predicts that rNTP chain terminators lacking a 3'-OH should inhibit HIV-1 reverse transcription in macrophages. Indeed, 3'-deoxyadenosine inhibits HIV-1 proviral DNA synthesis in human macrophages more efficiently than in CD4(+) T cells. This study reveals that the biochemical landscape of HIV-1 replication in macrophages is unique and that ribonucleoside chain terminators may be a new class of anti-HIV-1 agents specifically targeting viral macrophage infection.
Figures


Similar articles
-
Frequent incorporation of ribonucleotides during HIV-1 reverse transcription and their attenuated repair in macrophages.J Biol Chem. 2012 Apr 20;287(17):14280-8. doi: 10.1074/jbc.M112.348482. Epub 2012 Mar 1. J Biol Chem. 2012. PMID: 22383524 Free PMC article.
-
Pre-steady state kinetic analysis of HIV-1 reverse transcriptase for non-canonical ribonucleoside triphosphate incorporation and DNA synthesis from ribonucleoside-containing DNA template.Antiviral Res. 2015 Mar;115:75-82. doi: 10.1016/j.antiviral.2014.12.016. Epub 2014 Dec 31. Antiviral Res. 2015. PMID: 25557601 Free PMC article.
-
Viral protein X reduces the incorporation of mutagenic noncanonical rNTPs during lentivirus reverse transcription in macrophages.J Biol Chem. 2020 Jan 10;295(2):657-666. doi: 10.1074/jbc.RA119.011466. Epub 2019 Dec 5. J Biol Chem. 2020. PMID: 31806704 Free PMC article.
-
Antiviral profile of HIV inhibitors in macrophages: implications for therapy.Curr Top Med Chem. 2004;4(9):1009-15. doi: 10.2174/1568026043388565. Curr Top Med Chem. 2004. PMID: 15134554 Review.
-
HIV Persistence in Adipose Tissue Reservoirs.Curr HIV/AIDS Rep. 2018 Feb;15(1):60-71. doi: 10.1007/s11904-018-0378-z. Curr HIV/AIDS Rep. 2018. PMID: 29423731 Free PMC article. Review.
Cited by
-
Host factor SAMHD1 restricts DNA viruses in non-dividing myeloid cells.PLoS Pathog. 2013;9(6):e1003481. doi: 10.1371/journal.ppat.1003481. Epub 2013 Jun 27. PLoS Pathog. 2013. PMID: 23825958 Free PMC article. Clinical Trial.
-
Tight interplay among SAMHD1 protein level, cellular dNTP levels, and HIV-1 proviral DNA synthesis kinetics in human primary monocyte-derived macrophages.J Biol Chem. 2012 Jun 22;287(26):21570-4. doi: 10.1074/jbc.C112.374843. Epub 2012 May 14. J Biol Chem. 2012. PMID: 22589553 Free PMC article.
-
The Role of Macrophages in HIV-1 Persistence and Pathogenesis.Front Microbiol. 2019 Dec 5;10:2828. doi: 10.3389/fmicb.2019.02828. eCollection 2019. Front Microbiol. 2019. PMID: 31866988 Free PMC article. Review.
-
HIV-1 restriction factor SAMHD1 is a deoxynucleoside triphosphate triphosphohydrolase.Nature. 2011 Nov 6;480(7377):379-82. doi: 10.1038/nature10623. Nature. 2011. PMID: 22056990
-
Remdesivir is a direct-acting antiviral that inhibits RNA-dependent RNA polymerase from severe acute respiratory syndrome coronavirus 2 with high potency.J Biol Chem. 2020 May 15;295(20):6785-6797. doi: 10.1074/jbc.RA120.013679. Epub 2020 Apr 13. J Biol Chem. 2020. PMID: 32284326 Free PMC article.
References
-
- Björklund S., Skog S., Tribukait B., Thelander L. (1990) Biochemistry 29, 5452–5458 - PubMed
-
- Chabes A. L., Björklund S., Thelander L. (2004) J. Biol. Chem. 279, 10796–10807 - PubMed
-
- Jamburuthugoda V. K., Chugh P., Kim B. (2006) J. Biol. Chem. 281, 13388–13395 - PubMed
-
- Traut T. (1994) Mol. Cell. Biochem. 140, 1573–4919 - PubMed
-
- Stridh S. (1983) Arch. Virol. 77, 223–229 - PubMed
Publication types
MeSH terms
Substances
Grants and funding
- P30 AI050409/AI/NIAID NIH HHS/United States
- R01 AI076535/AI/NIAID NIH HHS/United States
- 2P30-AI-050409/AI/NIAID NIH HHS/United States
- R01 AI049781/AI/NIAID NIH HHS/United States
- TL1 RR024135/RR/NCRR NIH HHS/United States
- 5R37-AI-041980/AI/NIAID NIH HHS/United States
- R37 AI041980/AI/NIAID NIH HHS/United States
- T32 AI007362/AI/NIAID NIH HHS/United States
- R37 AI025899/AI/NIAID NIH HHS/United States
- R56 AI049781/AI/NIAID NIH HHS/United States
- AI049781/AI/NIAID NIH HHS/United States
- 5R37-AI-025899/AI/NIAID NIH HHS/United States
- R01 OD011094/OD/NIH HHS/United States
- R01-AI-076535/AI/NIAID NIH HHS/United States
LinkOut - more resources
Full Text Sources
Other Literature Sources
Research Materials

