. 2010 Dec;30(23):5572-81.
doi: 10.1128/MCB.00917-10. Epub 2010 Oct 4.

Dual functions of Nbs1 in the repair of DNA breaks and proliferation ensure proper V(D)J recombination and T-cell development

Affiliations

Dual functions of Nbs1 in the repair of DNA breaks and proliferation ensure proper V(D)J recombination and T-cell development

Amal Saidi et al. Mol Cell Biol. 2010 Dec.

Abstract

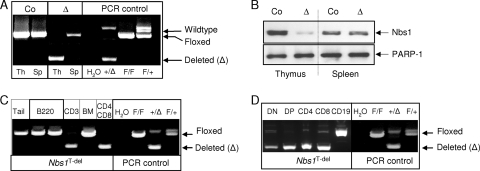
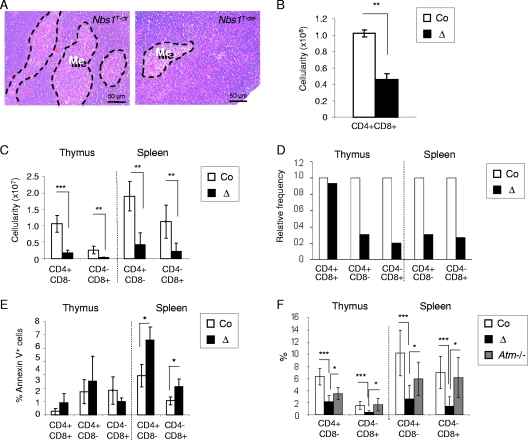
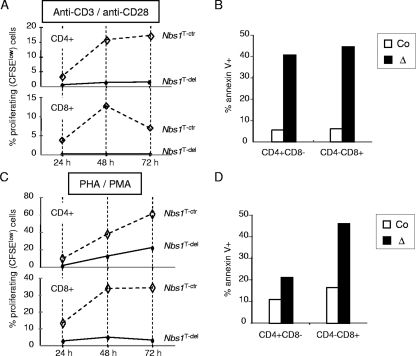
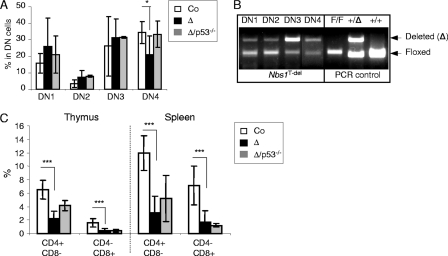
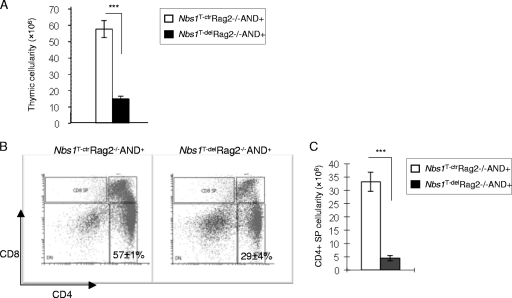
Immunodeficiency and lymphoid malignancy are hallmarks of the human disease Nijmegen breakage syndrome (NBS; OMIM 251260), which is caused by NBS1 mutations. Although NBS1 has been shown to bind to the T-cell receptor alpha (TCRα) locus, its role in TCRβ rearrangement is unclear. Hypomorphic mutations of Nbs1 in mice and patients result in relatively mild T-cell deficiencies, raising the question of whether the truncated Nbs1 protein might have clouded a certain function of NBS1 in T-cell development. Here we show that the deletion of the entire Nbs1 protein in T-cell precursors (Nbs1(T-del)) results in severe lymphopenia and a hindrance to the double-negative 3 (DN3)-to-DN4 transition in early T-cell development, due to abnormal TCRβ coding and signal joints as well as the functions of Nbs1 in T-cell expansion. Chromatin immunoprecipitation (ChIP) analysis of the TCR loci reveals that Nbs1 depletion compromises the loading of Mre11/Rad50 to V(D)J-generated DNA double-strand breaks (DSBs) and thereby affects resection of DNA termini and chromatin conformation of the postcleavage complex. Although a p53 deficiency relieves the DN3→DN4 transition block, neither a p53 deficiency nor ectopic expression of TCRαβ rescues the major T-cell loss in Nbs1(T-del) mice. All together, these results demonstrate that Nbs1's functions in both repair of V(D)J-generated DSBs and proliferation are essential for T-cell development.


Figures

FIG. 1.
FIG. 1.
The specific deletion of Nbs1 in the T-cell lineage. (A) PCR analysis of the Nbs1 deletion in the thymus (Th) and spleen (Sp) of the indicated genotype. “Co” and “Δ” represent samples obtained from Nbs1T-ctr and Nbs1T-del mice, respectively. PCR controls used Nbs1F6 (F) and Nbs1-deleted (Δ) alleles. (B) Western blot analysis of the Nbs1 deletion in thymi and spleens of 4-week-old Nbs1T-ctr and Nbs1T-del mice. PARP-1 is used as a loading control. (C) PCR analysis of the Nbs1 deletion in genomic DNA from sorted CD3+, B220+, and CD4+ CD8+ populations from Nbs1T-del thymi and spleens as well as bone marrow (BM) cells. Tail DNA (tail) is used to control the floxed allele. (D) PCR analysis of the Nbs1 deletion in sorted CD19+, CD4+, CD8+, and CD4+ CD8+ populations from Nbs1T-del thymi and spleens.
FIG. 2.
FIG. 2.
Nbs1T-del mice develop central and peripheral T-cell lymphopenia. (A) H&E staining of thymus sections from 4-week-old Nbs1T-ctr and Nbs1T-del mice. Me, medulla. (B) Numbers of CD4+ CD8+ DP T cells in the thymi of Nbs1T-ctr and Nbs1T-del mice (n > 6; 3 to 5 weeks of age). (C) Numbers of CD4+ and CD8+ SP T cells in the thymi and spleens of Nbs1T-del mice are compared to those in the thymi and spleens of Nbs1T-ctr mice (n > 6; 3 to 5 weeks of age). (D) Frequency of CD4+ CD8+ DP, CD4+ SP, and CD8+ SP T cells in the thymi and spleens of Nbs1T-del mice relative to the controls (n > 6; 3 to 5 weeks of age). (E) Proportion of annexin V-positive T cells in the thymi and spleens of Nbs1T-ctr and Nbs1T-del mice. (F) Comparison of lymphopenia in Nbs1T-del and Atm−/− mice. The histogram shows the comparison of the average percentages of CD4+ and CD8+ SP T cells in the thymi and spleens of Nbs1T-ctr, Nbs1T-del, and Atm−/− mice (n > 4; 3 to 5 weeks of age). Co, Nbs1T-ctr; Δ, Nbs1T-del; *, P < 0.05; **, P < 0.01; ***, P < 0.001. P values were obtained using Student's unpaired t test.
FIG. 3.
FIG. 3.
Cellular response to T-cell activation in Nbs1T-del mice. (A) Thymocytes were stimulated with anti-CD3/anti-CD28 antibodies and labeled with CFSE. The proliferation of Nbs1T-ctr and Nbs1T-del CD4+ and CD8+ SP T cells was analyzed at the indicated time points by flow cytometry, according to the CFSE dilution. (B) Apoptotic cells after stimulation with anti-CD3/anti-CD28 antibodies were determined by annexin V staining. (C) Thymocytes were stimulated with PMA/PHA and labeled with CFSE. The proliferation of Nbs1T-ctr and Nbs1T-del CD4+ and CD8+ SP T cells was analyzed at the indicated time points by flow cytometry, according to the CFSE dilution. (D) Apoptosis after PMA/PHA treatment was determined by annexin V staining. Co, Nbs1T-ctr; Δ, Nbs1T-del.
FIG. 4.
FIG. 4.
The Nbs1-null mutation affects the transition from the DN3 to DN4 stages in early T-cell development. (A) The histogram shows the different DN subpopulations in the total DN population, according to their surface markers CD44 and CD25. These data are the mean percentages for at least 6 mice from each genotype. (B) PCR analysis of the Nbs1 deletion in sorted DN subpopulations, according to their CD44 and CD25 expression profiles. F, Nbs1 floxed allele; Δ, Nbs1-deleted allele. (C) Frequencies of CD4+ and CD8+ SP T cells obtained from 4-week-old littermates of Nbs1T-ctr, Nbs1T-del, and Nbs1T-del p53−/− mice. These data are the mean percentages for at least three mice from each genotype. Co, Nbs1T-ctr; Δ, Nbs1T-del; Δ/p53, Nbs1T-del p53−/−; *, P < 0.05; ***, P < 0.001. P values were obtained using Student's unpaired t test.
FIG. 5.
FIG. 5.
Nbs1 deletion results in aberrant processing of V(D)J coding ends and signal ends. (A) Scheme for V(D)J recombination in TCR Vβ 13, Dβ1 or Dβ2, and Jβ 2.7 gene loci. Arrowheads indicate primer positions. (B) TCRβ gene rearrangement analyzed by sequencing the PCR products of indicated segments in genomic DNA isolated from 4-week-old Nbs1T-ctr and Nbs1T-del thymocytes. n, number of PCR products analyzed. The original data are shown in Tables S1 and S2 in the supplemental material. (C) PCR sequencing analysis of TCRβ gene rearrangements in thymocyte DNA isolated from 4-week-old Nbs1T-ctr and Nbs1T-del mice. The frequency of the V(D)J joints is plotted. (D) Size of resolved Vβ13-Dβ1/2-Jβ2.7 regions in Nbs1T-ctr and Nbs1T-del mice. (E) Nucleotide usages in Vβ14-Dβ1 and Jα56-ADV8 signal joints of control and Nbs1T-del mice (n, number of sequences used for the GC/AT ratio calculation). The P value is calculated using the percentage of GC in imperfect joints (see Tables S3 and S4 in the supplemental material). Co, Nbs1T-ctr; Δ, Nbs1T-del; *, P < 0.05; **, P < 0.01; n.s., not significant. The chi-square test was used for calculations in panels B and C, and the unpaired Student's t test was used for calculations in panels D and E.
FIG. 6.
FIG. 6.
Defects in V(D)J-initiated DNA repair, chromosome instability, and impaired DDR in Nbs1-deleted T cells. (A) ChIP analysis using antibodies against Rad50, γ-H2AX, and Ac-H4. These antibodies recovered distal and proximal Vβ (left) and Vα (right) regions of Nbs1T-ctr and Nbs1T-del thymocytes. Co, Nbs1T-ctr; Δ, Nbs1T-del; γ-H2AX, phospho-histone H2AX; Ac-H4, acetyl-histone H4. (B) Summary of the chromosomal stability in Nbs1T-ctr and Nbs1T-del T cells. The metaphases were prepared from 8-week-old Nbs1T-ctr and Nbs1T-del T cells 48 h after IL-2/PMA/ionomycin stimulation. n, number of metaphases analyzed. **, P < 0.01. Student's unpaired t test was used, except that the chi-square test was applied for calculation of the percentage of metaphases containing aberrations. (C) Western blot analysis of Nbs1 and Chk2 in whole-cell extracts from Nbs1T-ctr and Nbs1T-del thymocytes after 2 h of treatment with 0.2 μg/ml of adriamycin (Adr). PARP-1 is used as a loading control. The ratio of the phosphorylated form of Chk2 (upper band) was corrected to that of the nonphosphorylated form (lower band) by ImageJ software and indicated under the corresponding lanes. NA, not applicable.
FIG. 7.
FIG. 7.
Rescue experiment of T-cell lymphopenia in Nbs1T-del mice with the TCRαβ transgene (AND) and a Rag2 deficiency. (A) The total thymus cellularity in Nbs1T-ctr Rag2/− AND+ (n = 2) and Nbs1T-del Rag2−/− AND+ (n = 6) mice. (B) Representative T-cell profiles of the thymocytes obtained from two Nbs1T-ctr Rag2/− AND+ mice and four age-matched Nbs1T-del Rag2−/− AND+ mice. (C) The total number of CD4+ SP cells obtained from thymi of Nbs1T-del mice (n = 2) relative to the controls (n = 4) in the Rag2−/− AND+ genetic backgrounds. ***, P < 0.001 using Student's unpaired t test.

Similar articles

Cited by

References

    1. Barlow, C., S. Hirotsune, R. Paylor, M. Liyanage, M. Eckhaus, F. Collins, Y. Shiloh, J. N. Crawley, T. Ried, D. Tagle, and A. Wynshaw-Boris. 1996. Atm-deficient mice: a paradigm of ataxia telangiectasia. Cell 86:159-171. - PubMed
    1. Bassing, C. H., W. Swat, and F. W. Alt. 2002. The mechanism and regulation of chromosomal V(D)J. recombination. Cell 109:S45-S55. - PubMed
    1. Bird, A. W., D. Y. Yu, M. G. Pray-Grant, Q. Qui, K. E. Harmon, P. C. Megee, P. A. Grant, M. M. Smith, and M. F. Christman. 2002. Acetylation of histone H4 by Esa1 is required for DNA double-strand break repair. Nature 419:411-415. - PubMed
    1. Buis, J., Y. Wu, Y. Deng, J. Leddon, G. Westfield, M. Eckersdorff, J. M. Sekiguchi, S. Chang, and D. O. Ferguson. 2008. Mre11 nuclease activity has essential roles in DNA repair and genomic stability distinct from ATM activation. Cell 135:85-96. - PMC - PubMed
    1. Candeias, S., K. Muegge, and S. K. Durum. 1996. Junctional diversity in signal joints from T cell receptor beta and delta loci via terminal deoxynucleotidyl transferase and exonucleolytic activity. J. Exp. Med. 184:1919-1926. - PMC - PubMed

Publication types

MeSH terms

LinkOut - more resources