. 2010 Sep 29;30(39):12918-35.
doi: 10.1523/JNEUROSCI.1806-10.2010.

Lesions in posterior parietal area 5 in monkeys result in rapid behavioral and cortical plasticity

Affiliations

Lesions in posterior parietal area 5 in monkeys result in rapid behavioral and cortical plasticity

Jeffrey Padberg et al. J Neurosci. .

Abstract

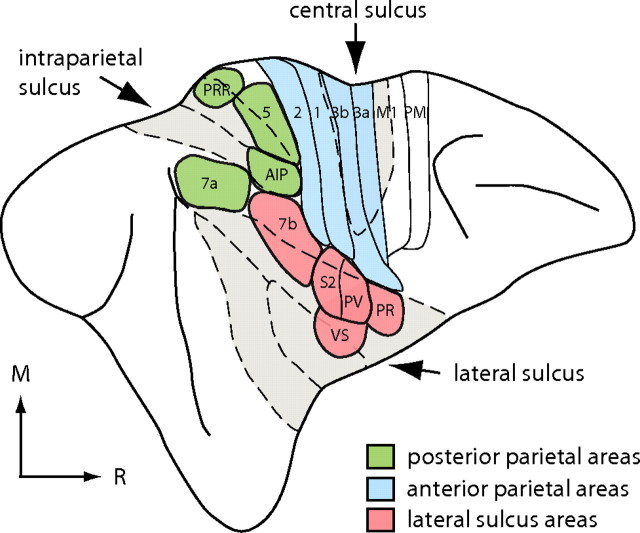
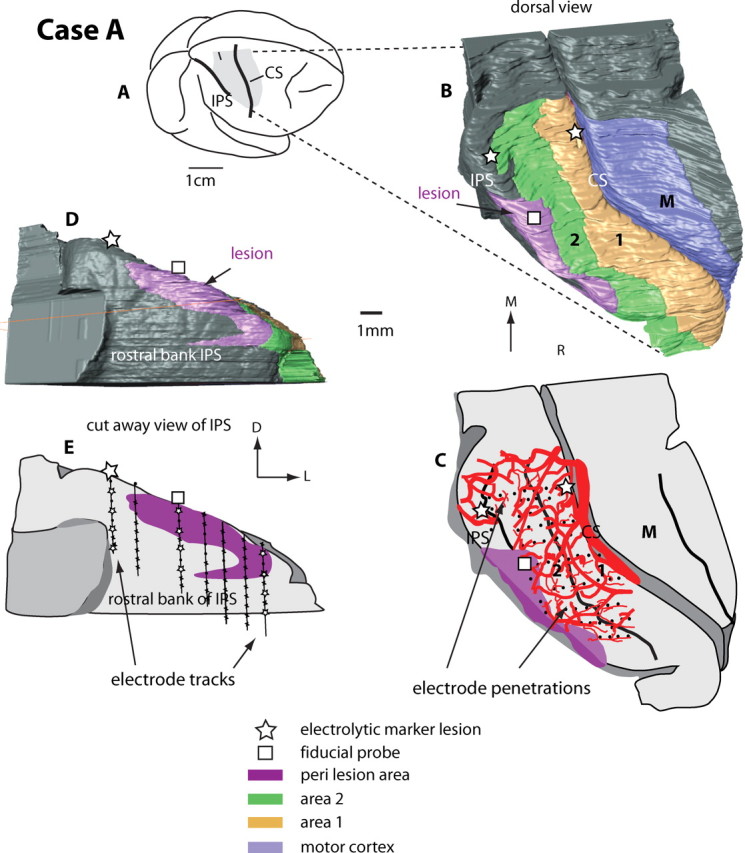
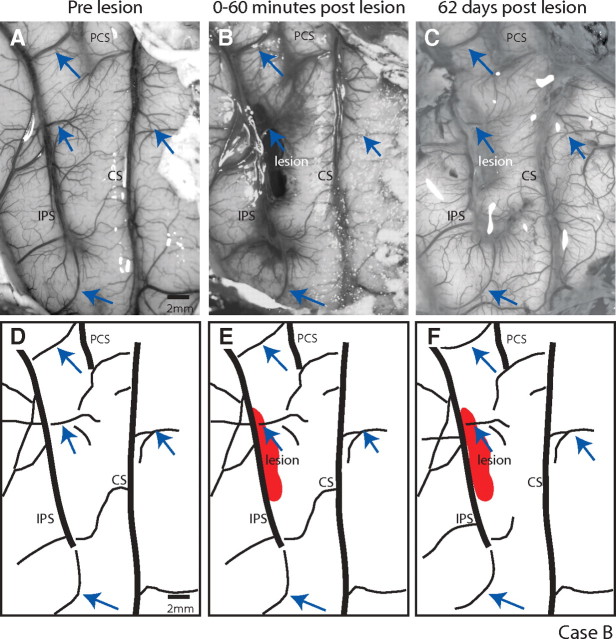
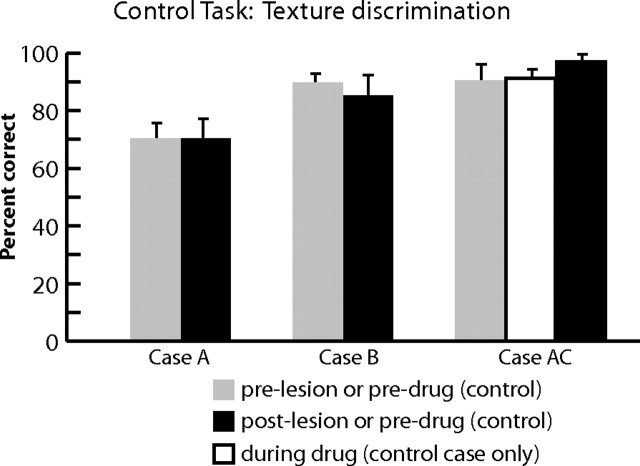
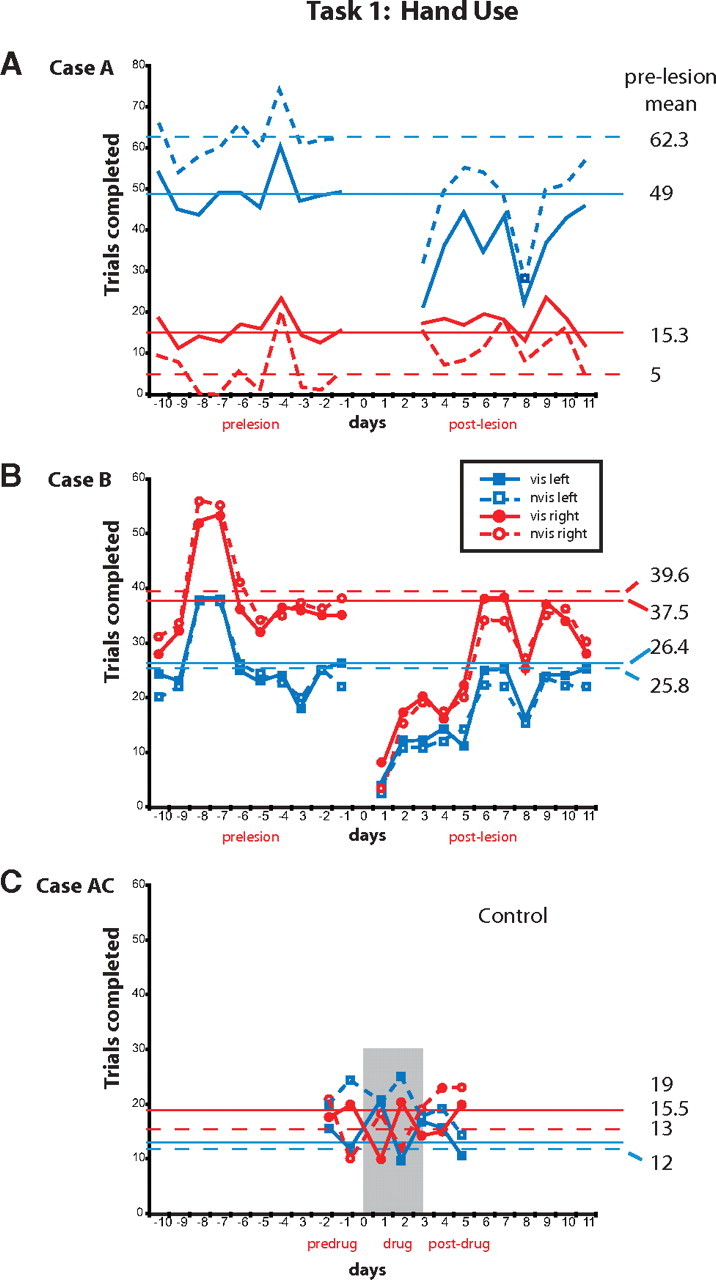
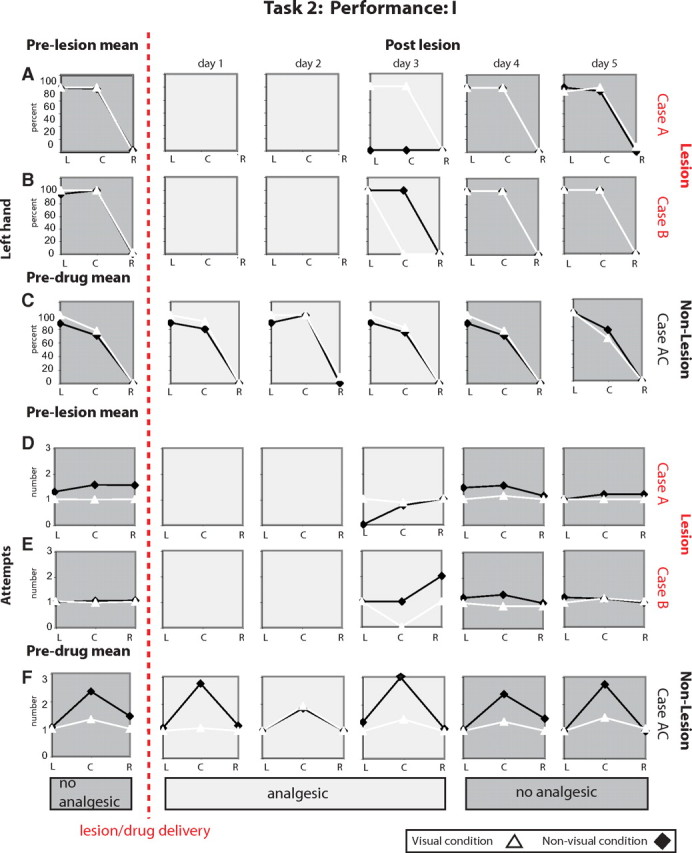
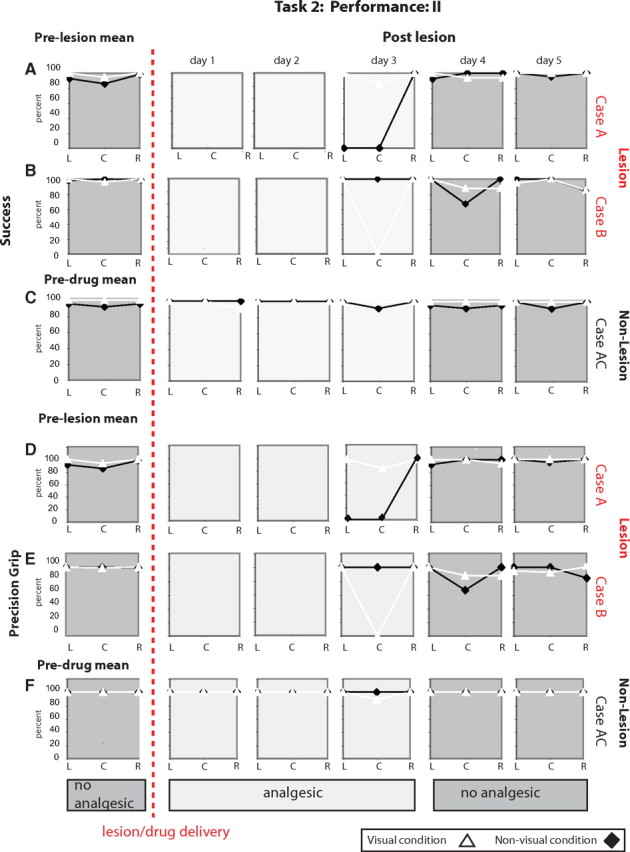
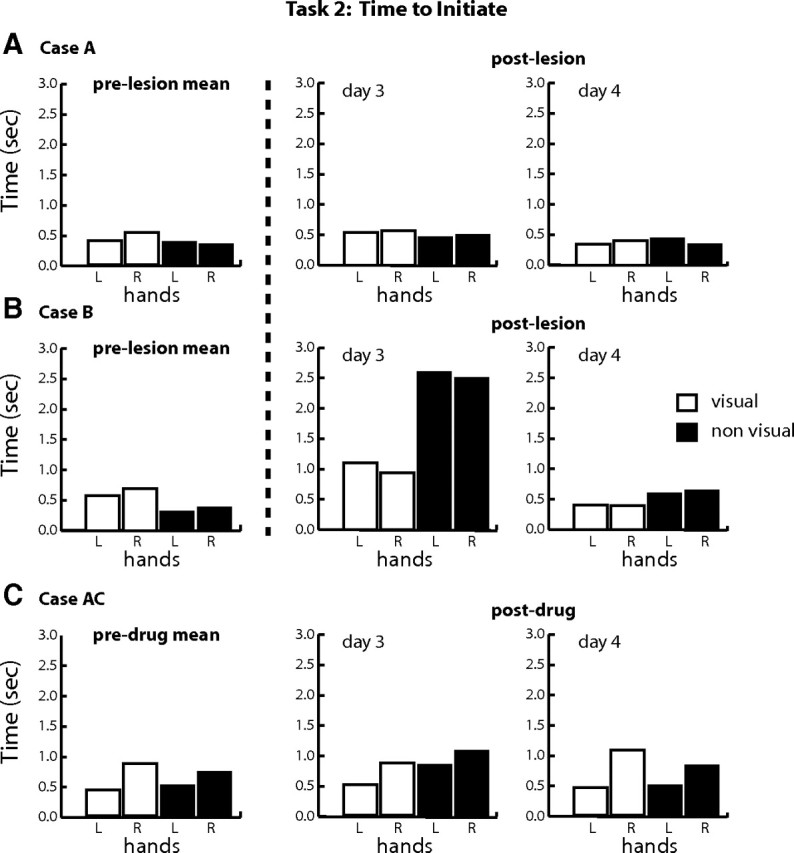
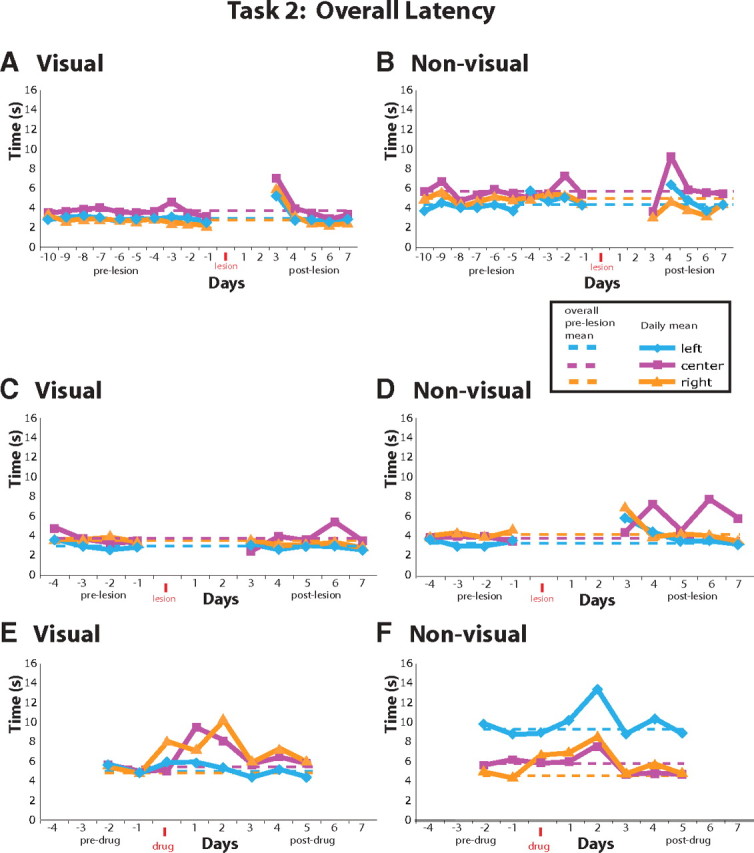
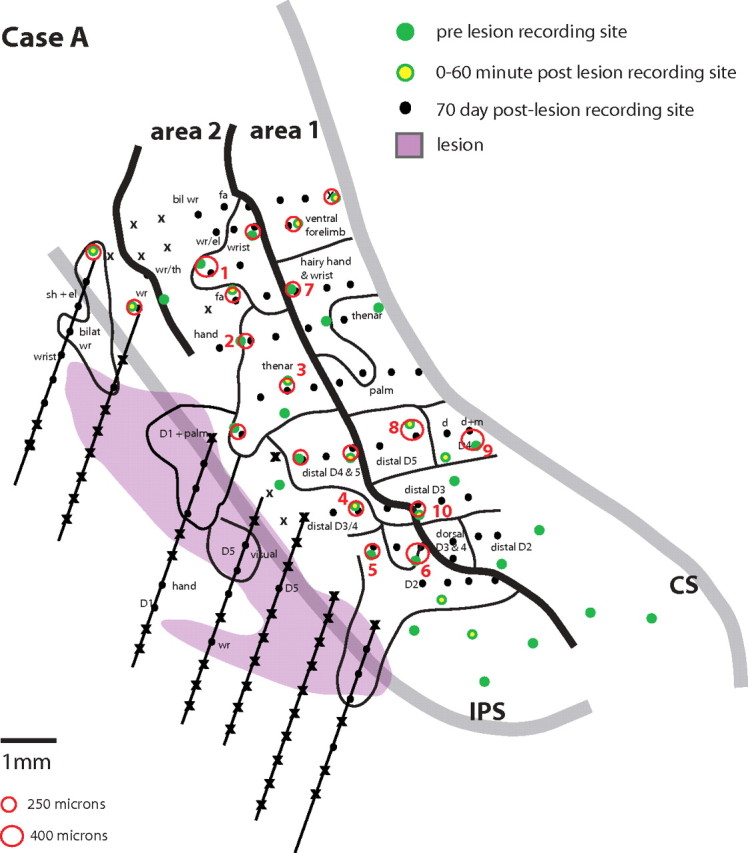
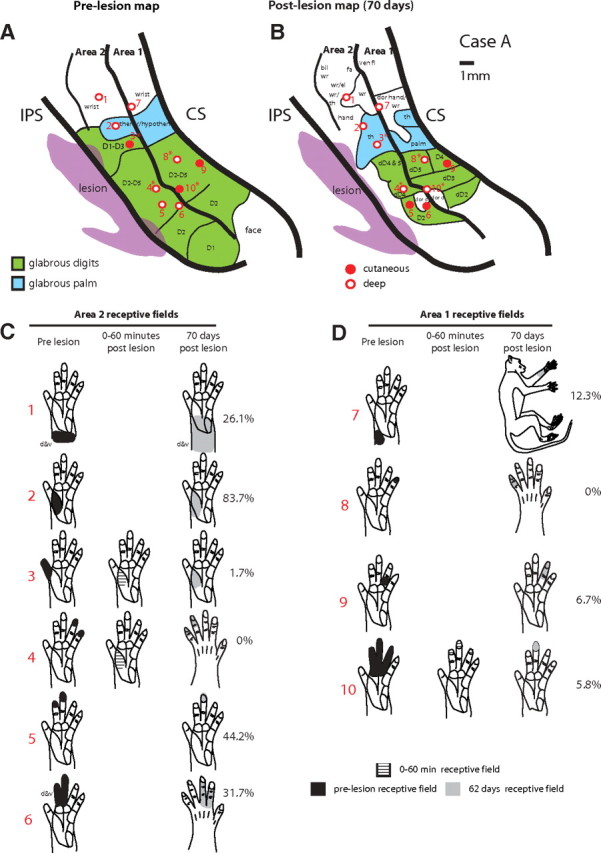
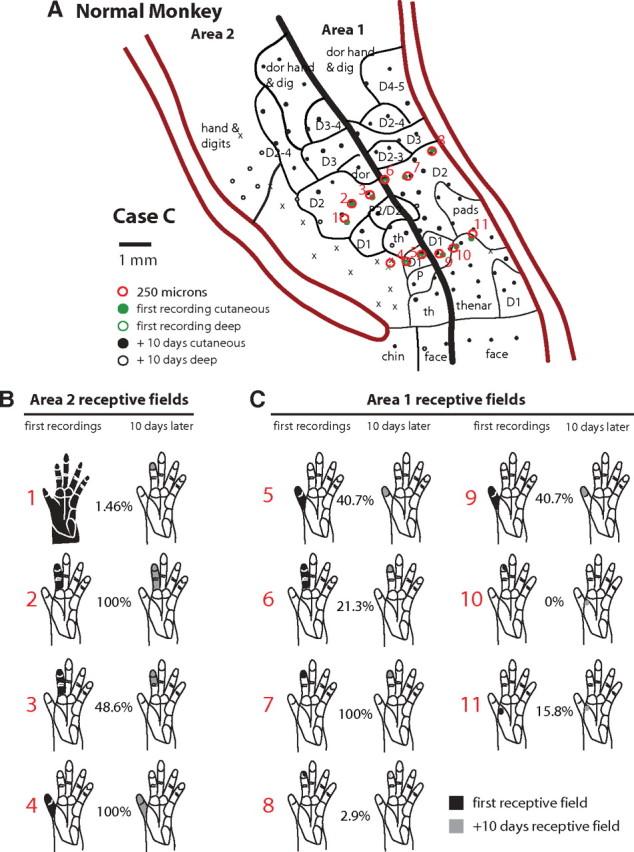
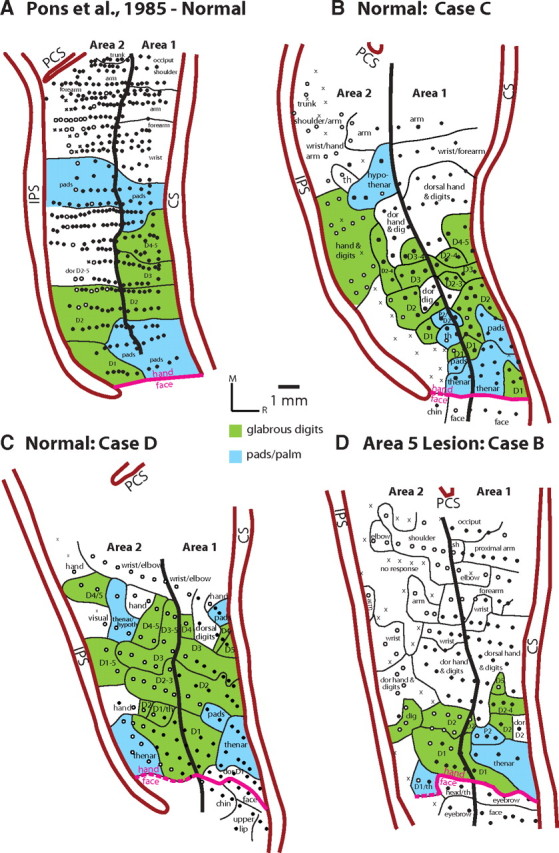
We examined the effects of focal lesions of posterior parietal area 5 in macaque monkeys on bimanual behavior performed with and without visual guidance. The animals were trained on two reaching tasks and one tactile texture discrimination task. Task 1 simply involved reaching toward and grasping a reward from one of five well positions. Task 2 required the monkey to use both hands simultaneously to obtain a reward. The tactile texture discrimination task required the monkey to signal the roughness of a passively delivered texture using its jaw. After lesions to area 5, the monkeys showed a decrease in hand use for tasks 1 and 2 and an inability to perform task 2 in specific locations in visual space. These deficits recovered within several days. No deficits were observed in the tactile texture discrimination task or in an analgesic control monkey. Electrophysiological recordings made just before the lesion, immediately after the lesion, and 2 months after the lesion demonstrated that cortical areas just rostral to the lesioned area 5, and areas 1 and 2, were topographically reorganized and that receptive fields for neurons in these fields changed location on the body surface. These cortical map changes are correlative and may, in part, contribute to the rapid behavioral recovery observed. The mechanism for such rapid changes may be the unmasking of existing divergent and convergent thalamocortical connections that are part of the normal cortical circuitry.


Figures

Figure 1.
Figure 1.
The location and extent of somatosensory areas in anterior parietal cortex (blue), posterior parietal cortex (green), and lateral sulcus (pink). Areas in anterior parietal cortex process inputs from cutaneous and deep receptors of the skin, muscle, and joints. Although area 5 is driven by stimulation of somatic receptors, neurons here also respond to visual stimulation. Neurons in areas 5 and AIP are active during reaching and grasping in awake animals. Solid lines mark architectonic boundaries, and dashed lines mark sulci that have been reflected to display areas on the banks of the sulci. Abbreviations are defined in Table 1.
Figure 2.
Figure 2.
A–D, A monkey performing task 1 (A–C) and task 2 (D) under different conditions. For task 1, the monkey was required to retrieve a reward from one of five well locations under visual (A, B) or nonvisual (C) guidance. Some of the scoring conditions are listed in the panels below the figures. For task 2 (D), in this trial the monkey performed the task under visual guidance, the reward location was left, the hand used to retrieve was left, and the grip was precision. For videotape scoring, see supplemental Tables 1 and 2 (available at www.jneurosci.org as supplemental material).
Figure 3.
Figure 3.
A, B, Horizontal sections that have been stained for Nissl in case A (A) and case B (B). In case A, the walls of the lesion were pushed toward the center. In case B, the area of the lesion was clearly visible since the walls of the lesioned area did not push in to fill the lesioned space after the recovery period. The white matter below area 5 was not significantly affected by the lesion and was only superficially involved. The boundaries of areas 2 and 1 could still be identified. Thin dashed lines mark architectonic boundaries. Abbreviations are defined in Table 1.
Figure 4.
Figure 4.
A–E, An example of 3D data generation and analysis from case A. The region of the cortex studied in detail is depicted as the gray shaded region in A. A 3D blowup of this region is illustrated in B. This illustration includes architectonically defined cortical areas (green, gold and purple), the perilesion area (dark pink), the location of fiducial probes (square), electrolytic marker lesions (stars), and sulci. An illustration of this 3D reconstruction is shown below in C, and contains the features in illustration B, plus the vascular pattern and electrophysiological recording sites. The Amira software used to generate this 3D reconstruction allows us the rotate the reconstruction in any plane and to digitally “cut away” sulcal walls. The 3D reconstruction shown in D is a view of the rostral bank of the intraparietal sulcus with the posterior bank cut away. This shows the location of the perilesion region into the depth of the sulcus and as well as the location of the fiducial probe and an electrolytic lesion made during the final mapping session. An illustration of this 3D reconstruction is shown in E, which also contains electrode tracks (and their angle) into the IPS as well as recording sites along those tracks. Abbreviations are defined in Table 1.
Figure 5.
Figure 5.
Alignment of digital images of the exposed neocortex before and after the lesion to area 5. A–F, Digital image and an illustration of the cortex taken before (A, D), immediately after (B, E), and 62 d after (C, F) a lesion to area 5 in case B. Major sulci and large and moderate sized blood vessels (blue arrows) could be readily identified and used to align these images. The lesion itself also served to help align images across time points. In this way, electrophysiological recording sites marked on these images could be compared across time points. The lesion is denoted in red in E and F. Abbreviations are defined in Table 1.
Figure 6.
Figure 6.
Results for the two area 5 lesioned monkeys (cases A and B), and the analgesic control monkey (case AC) on a rough vs. smooth somatosensory discrimination task using the left (contralesional) hand. There was no statistically significant difference in accuracy on this task between prelesion versus postlesion sessions (p > 0.05) difference in performance on this task in either lesioned monkey or in the analgesic control monkey.
Figure 7.
Figure 7.
A–C, The mean daily hand use for task 1 collapsed across conditions and wells before and after lesions [cases A (A) and B (B)] and before, during, and after analgesic administration [case AC (C)]. The right hemisphere in both monkeys in A and B had the area 5 lesion. After the lesion, the use of the left hand dropped dramatically for this task for the lefted monkey (case A), and in the ambidextrous monkey (case B) the use of both hands dropped dramatically. Hand use in the analgesic control monkey (case AC) was unchanged during the administration of drugs for 3 d (gray shaded region). Solid blue lines indicate left hand/visual condition; dashed blue lines indicate left hand/nonvisual condition; solid red lines indicate right hand/visual condition; and dashed red lines indicate right hand/nonvisual condition. Prelesion and preanalgesic means are shown at the far right.
Figure 8.
Figure 8.
A–F, Performance on task 2 for the two lesioned monkeys (A, B, D, E) and the analgesic control (C, F) on both the use of the contralesion left hand to retrieve the reward (A–C) and the number of attempts (D–F). The lesioned monkeys were unable to perform the task the first 2 d after the lesion while the analgesic control monkey performed the task normally (C, F). On the third postlesion day of testing, the left-handed monkey [case A (A)] did not use the contralesional left hand to retrieve the reward from the left or central location in the nonvisual condition, while case B did not use the contralesion hand to retrieve the treat from the central location under visual guidance (B). Both lesioned monkeys could not complete the task for retrieval (D, E) or increased the number of attempts for retrieval (E) on the third day after the lesion. For both lesioned monkeys performance returned to normal by the fourth or fifth postlesion day.
Figure 9.
Figure 9.
A–F, Performance on task 2 for the two lesioned monkeys (A, B, D, E) and the analgesic control (C, F) for success rate (A–C) and the use of the precision grip when retrieving a reward (D–F). Lesioned monkeys were unable to perform the task in the first 2 d after the lesion while the analgesic control monkey performed the task normally throughout the administration of the analgesic (C, F). The success rate for the left-handed monkey [case A (A)] dropped for the left and center well location while the second monkey (case B) had a poor success rate for the central well location compared with prelesion behavior. Further, the use of the precision grip changed for both lesioned monkeys (D, E).
Figure 10.
Figure 10.
A, B, Time to initiate task 2. For both lesion monkeys [case A (A) and case B (B)], the time to initiate task 2 increased for both hands compared with prelesion means. C, For the analgesic control monkey, the time to initiate the task increased for the nonvisual left and center conditions (p < 0.05) but returned to normal after the administration of analgesic. The dashed line marks the time of lesion, prelesion means were derived from session performed 1–10 d before the lesions were made. L, Left hand; R, right hand.
Figure 11.
Figure 11.
Overall latencies for task 2. The latency to complete task 2 after the lesion was compared with prelesion means for both monkeys, and before, during, and after analgesic adiministration in the control monkey (E, F). A, B, For case A, the overall latency to complete task 2 was dramatically increased for all three well positions on postlesion day 3, but returned to normal for all three well positions by postlesion day 4 for the visual condition. The latencies in the nonvisual condition were below prelesion means because the monkey did not perform the task or dropped the cylinder before the task was complete. The second monkey (case B; C, D) only the nonvisual condition was affected such that latencies for the left and right location increased. The performance on the center location was erratic until the eighth postlesion day. E, F, For the analgesic control monkey, the latencies during administration of analgesics increased during the first day only, and the presence of the analgesic (oxymorphone) did not impair the animals ability to actually perform the task.
Figure 12.
Figure 12.
A comprehensive reconstruction in which prelesion, immediate postlesion, and 70 d postlesion recording sites have been merged (case A). Some sites from the different maps are identical and others are within a 250–400 μm diameter from each other. The circles at the bottom indicate scaled diameters for recording site comparison. Sites that were farther apart were not considered for comparison. Numbered sites on this comprehensive map match those on the map in Fig. 15. Abbreviations are defined in Table 1.
Figure 13.
Figure 13.
A–D, Reconstructions of a prelesion map (A), a 70 d postlesion map (B), and corresponding receptive fields for neurons in area 2 (C) and area 1 (D) in case A. A, B, Representations of the glabrous hand are shaded in green and representations of the glabrous palm are shaded in blue. Representations of the glabrous hand decreased in size after the lesion and receptive fields for neurons at most sites changed locations 70 d after the lesion, and in most instances immediately after the lesion (e.g., RF 3, 4 and 10). The overall overlap index for this monkey was 20%. Conventions are as in Figure 12. Abbreviations are as defined in Table 1.
Figure 14.
Figure 14.
A–D, Reconstructions of a prelesion map (A) and a 62 d postlesion map (B), and corresponding receptive fields for neurons in area 2 (C) and area 1 (D) in case B. A, B, Representations of the glabrous hand are shaded in green and representations of the glabrous palm are shaded in blue. The representation of the glabrous hand in area 1 decreased in size after the lesion, and receptive fields for neurons at most sites changed locations 62 d after the lesion. The overall overlap index in this case was 0%. Conventions are as in previous figures. Abbreviations are as defined in Table 1.
Figure 15.
Figure 15.
A–C, Maps of areas 1 and 2 (A) with corresponding receptive fields at marked locations in areas 2 (B) and 1 (C) in a normal monkey. This map was generated from multiple recording sites in case C. At recording sites 1–11, receptive fields were obtained at 2 time points. An early time point (black receptive fields) and 10 d later (gray receptive fields). The location of the receptive fields was very similar across both time points except at two locations. The overall overlap index for this case was 43%. Abbreviations are as defined in Table 1. Conventions are as in previous figures.
Figure 16.
Figure 16.
A–D, Maps of areas 1 and 2 in three normal monkeys (A–C), and in one monkey in which area 5 was lesioned (D). The map in A was generated by Pons et al. (1985), and the maps in B and C were generated in our own laboratory. Representations of the glabrous digits are shaded in green and representations of the glabrous palm is marked in blue. The hand and face boundary is marked as a pink line. While there is variability in the organization of areas 1 and 2 in normal monkeys, the representation of the glabrous hand is quit large in these monkeys, and representations of all digits are observed. The area of cortex devoted to the representation of the glabrous digits and palm in areas 1 and 2 in these monkeys is 46.7 mm2 in the Pons et al. (1985) study, 47.39 mm2 in case C, and 23 mm2 in the lesioned monkey (D). The size of the glabrous hand representation in in the lesioned monkey is well outside the normal variability observed in normal monkeys. Abbreviations are as defined in Table 1. Conventions as are in previous figures.

Similar articles

Cited by

References

    1. Borra E, Belmalih A, Calzavara R, Gerbella M, Murata A, Rozzi S, Luppino G. Cortical connections of the macaque anterior intraparietal (AIP) area. Cereb Cortex. 2008;18:1094–1111. - PubMed
    1. Culham JC, Danckert SL, DeSouza JF, Gati JS, Menon RS, Goodale MA. Visually guided grasping produces fMRI activation in dorsal but not ventral stream brain areas. Exp Brain Res. 2003;153:180–189. - PubMed
    1. Culham JC, Cavina-Pratesi C, Singhal A. The role of parietal cortex in visuomotor control: what have we learned from neuroimaging? Neuropsychologia. 2006;44:2668–2684. - PubMed
    1. Dancause N, Barbay S, Frost SB, Zoubina EV, Plautz EJ, Mahnken JD, Nudo RJ. Effects of small ischemic lesions in the primary motor cortex on neurophysiological organization in ventral premotor cortex. J Neurophysiol. 2006;96:3506–3511. - PubMed
    1. Darian-Smith C. Plasticity of somatosensory function during learning, disease and injury. In: Kaas J, Gardner E, editors. The senses: a comprehensive reference. London: Elsevier; 2008. pp. 259–297.

Publication types

MeSH terms

LinkOut - more resources