. 2010 Sep 16;6(9):e1001103.
doi: 10.1371/journal.ppat.1001103.

Association of Tat with promoters of PTEN and PP2A subunits is key to transcriptional activation of apoptotic pathways in HIV-infected CD4+ T cells

Affiliations

Association of Tat with promoters of PTEN and PP2A subunits is key to transcriptional activation of apoptotic pathways in HIV-infected CD4+ T cells

Nayoung Kim et al. PLoS Pathog. .

Abstract

Apoptosis in HIV-1-infected CD4+ primary T cells is triggered by the alteration of the PI3K and p53 pathways, which converge on the FOXO3a transcriptional activator. Tat alone can cause activation of FOXO3a and of its proapoptotic target genes. To understand how Tat affects this pathway, we carried out ChIP-Chip experiments with Tat. Tat associates with the promoters of PTEN and two PP2A subunit genes, but not with the FOXO3a promoter. PTEN and PP2A encode phosphatases, whose levels and activity are increased when Tat is expressed. They counteract phosphorylation of Akt1 and FOXO3a, and so activate transcriptional activity of FOXO3a. FOXO3a promotes increased transcription of Egr-1, which can further stimulate the transcription of PTEN, thereby reinforcing the pathway that leads to FOXO3a transcriptional activation. RNAi experiments support the role of PTEN and PP2A in the initiation of the Tat-mediated cascade, which is critical to apoptosis. The increased accumulation of PTEN and PP2A subunit mRNAs during Tat expression is more likely to be the result of increased transcription initiation and not relief of promoter-proximal pausing of RNAPII. The Tat-PTEN and -PP2A promoter interactions provide a mechanistic explanation of Tat-mediated apoptosis in CD4+ T cells.


Conflict of interest statement

The authors have declared that no competing interests exist.

Figures
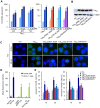
Figure 1
Figure 1. Tat and Tat mutants expression and apoptosis in Jurkat T cells.
A. mRNA levels of Tat in Jurkat T cells expressing TatSF2 at 24, 48, and 72 hrs after infection at MOI of 1, 10, and 20 (first panel) or wt and Tat mutants at 48 hrs after infection at MOI of 1, 10, and 20 (second panel), analyzed by qRT-PCR. Results are normalized to GAPDH and reported as fold induction relative to Ad-Tat samples infected at MOI of 1. The means ± SEM derived from three independent experiments are reported. B. Western blot analysis of Tat expression in Jurkat cells. C. Detection of wild type and mutant Tat in Jurkat cells. Nuclei are counterstained with DRAG5. D. Tat protein mean fluorescence intensity (MFI) of three independent flow cytometric analyses of Jurkat cells, after infection with different Tat expressing viruses. E. Apoptosis in Tat-expressing Jurkat T cells. Levels of early and late apoptosis are reported as percentage of Jurkat T cells that stain for Annexin V only (left panel) or Annexin V and 7AAD (right panel). The means ± SEM of three experiments are shown. *, p<0.05 when TatSF2 is compared to tTA control.
Figure 2
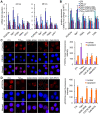
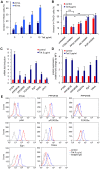
Figure 2. Tat-mediated cellular gene modulation in Jurkat T cells.
(A) mRNA levels of selected cellular genes 24 and 48 hours after infection with adenoviral vectors expressing wild type Tat and Tat mutants. B. Protein levels of cellular genes analyzed by flow cytometry analysis. Results are reported as fold increase of mean fluorescence intensity (MFI) relative to the tTA control. C. HIV-1 Tat increases FOXO3a nuclear localization in Jurkat T cells. Jurkat T cells infected with Ad-tTA or Ad-tTA+Ad-TatSF2 were analyzed by confocal microscopy 24 hrs after infection. Cells were stained with DRAG5 to visualize the nucleus (blue), and FOXO3a cellular localization (red) was detected using antibodies against FOXO3a (C) or p-FOXO3a (D). A quantitative analysis of nuclear and cytoplasmic FOXO3a or p-FOXO3a fluorescence intensity is provided at the right of each panel.
Figure 3
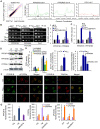
Figure 3. Tat associates with the PPP2R1B and PPP2R5E promoter and increases protein levels of PPP2R1B and PPP2R5E and PP2A activity in Jurkat cells.
A. Genes enriched in the Tat-immunoprecipitated DNA and associated with the PI3K pathway show a hybridization intensity with a P value lower than 0.001 (hybridization intensities with higher P values fall within the red lines). PPP2R1B, PPP2R5E, and Caveolin 1 (CAV1, negative control) promoter enrichment ratio (ChIP versus total input DNA in ChIP-on-Chip analysis) in Jurkat cells expressing TatSF2. B. ChIP analysis of the PPP2R1B and PPP2R5E promoters in Jurkat T cells expressing TatSF2. DNA from input (90, 30, 10 ng of DNA) and immunoprecipitated samples (3 ng of DNA) was amplified by standard PCR (P2 set of primers, see Supplemental Table S2) and run on 2% agarose gel (second and third panels). One representative experiment is shown in the 3 left panels. In the right panel, the average fold enrichment of a certain promoter in the immunoprecipitated DNA relative to input DNA ± SEM from three independent qPCR experiments is reported. All cycle threshold (Ct) values obtained with 10 ng of immunoprecipitated DNAs were compared with the Ct value obtained with 10 ng of the corresponding input DNA. C. mRNA levels of PPP2R1B and PPP2R5E in Jurkat T cells expressing TatSF2 or the mutant TatSF2G48-R57A, analyzed by qRT-PCR. Results are normalized to GAPDH and reported as fold induction relative to uninfected samples. The means ± SEM of three experiments are shown. D. Western blot analysis of PPP2R1B, PPP2R5E, and the catalytic subunit PP2A-C. Fold-increase compared to the uninfected control (UI) is indicated above the band. E. PP2A enzyme activity in lysates from Jurkat cells expressing TatSF2 alone or in the presence of siRNAs (left panel); serine/threonine phosphatase activity (middle panel), and total phosphatase activity (right panel) in lysates from Jurkat cells infected with Adeno-TatSF2 or with the Adeno-tTA control. Inhibition of tyrosine phosphatases and serine/threonine phosphatases was carried out by incubation of the lysate with sodium vanadate (1 mM) or okadaic acid (0.25 mM) in the phosphatase assay buffer. F. Tat increases PP2A expression and FOXO3a nuclear localization in Jurkat T cells. Jurkat T cells expressing tTA alone, TatSF2+tTA, or TatSF2G48-R57A +tTA were stained with antibodies against PPP2R1B (first and forth columns of panels, green), pFOXO3a (second column, red), and FOXO3a (forth column, red) and analyzed by confocal microscopy. Merged images are shown in the panels in the third and sixth columns. G. Quantitative analysis of the fluorescence intensity of cytoplasmic PPP2R1B, and of cytoplasmic and nuclear FOXO3a and pFOXO3a in Jurkat T cells expressing or tTA alone, TatSF2+tTA, or TatSF2G48-R57A +tTA. PPP2R1B and FOXO3a fluorescence was expressed as total intensity per cell (pixels above threshold x fluorescence intensity). Bars indicate the mean ± SEM of triplicate assays from two separate experiments. At least 100 cells were counted for each condition.
Figure 4
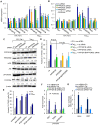
Figure 4. siRNA-mediated knockdown of PP2A reduces Tat-induced apoptosis in Jurkat T cells.
mRNA expression levels of (A) PPP2R1B and PPP2R5E and FOXO3a and (B) Egr1, GADD45A, and TRAIL in Jurkat T cells expressing TatSF2+tTA or tTA alone. Results are normalized to GAPDH and reported as fold induction relative to tTA expressing cells treated with ns siRNA. C. Western blot analysis of cell lysates treated with PPP2R1B and/or PPP2R5E siRNA or ns siRNA. D. Levels of apoptosis in the same cells 48 h after siRNA transduction, measured by staining for Annexin V and 7AAD. The means ± SEM of three independent experiments are reported. E. Levels of apoptosis in Jurkat cells infected with Ad-tTA or Ad-Tat and treated with an Akt inhibitor (50 µM Akt1-1/2), a PI3K inhibitor (10 nM LY294002), or a PP2A inhibitor (100 nM okadaic acid), measured by staining for Annexin V and 7AAD. F. ChIP analysis of the promoters of three FOXO3a target genes. ChIP was carried out with an anti-FOXO3a antibody in lysates of Jurkat T cells treated with ns siRNA or PPP2R1B siRNA and expressing TatSF2 or TatSF2K28A,K50A. Recovered DNA was analyzed by qPCR using primers specific for the Egr1, TRAIL, and GADD45A promoters. The average fold enrichment relative to tTA control from two independent experiments is reported. G. Luciferase activity of lysates from cells expressing tTA or TatSF2 and transfected with an Egr1-luciferase reporter vector. Firely luciferase activity was normalized to Renilla luciferase activity and results are reported as fold induction relative to cells treated with ns siRNA in the presence of tTA.
Figure 5
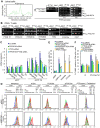
Figure 5. Tat association with the PTEN promoter.
A. PTEN promoter enrichment ratio (ChIP DNA versus total genomic DNA in ChIP-Chip analysis) in Jurkat cells expressing TatSF2 (first panel). ChIP analysis of the PTEN promoter in Jurkat T cells: two fold dilutions, starting from 5 ng, of DNA immunoprecipitated with anti-Flag antibody from samples expressing TatSF2 with or without FLAG or 10 ng of input DNA, used as positive control, were amplified by PCR (first gel). In the second and third gel the signals obtained by PCR carried out with input DNA (90, 30, 10 ng of DNA) or with 3 ng of DNA extracted from immunoprecipitated samples are shown. TatSF2G48-R57A was used as an additional negative control. P1 and P2 indicate 2 different sets of primers (Supplemental Table S3). B. ChIP analysis of the different cellular promoters in primary CD4+ T cells infected with a replication competent HIV expressing a flagged Tat. The signals obtained by standard PCR carried out with input DNA (90, 30, 10 ng of DNA) or with 1–5 ng of DNA extracted from immunoprecipitated samples are shown. The results obtained with two sets of primers, P1 and P2, are shown for the PTEN promoter. C. siRNA-mediated knockdown of PPP2R1B and PTEN reduces PPP2R1B, FOXO3a and FOXO3a-dependent gene expression in CD4+primary T cells infected with eGFP or eGFP-Tat retroviruses. RT-PCR results are normalized to GAPDH and reported as fold induction relative to cells treated with ns siRNA. Two independent experiments are reported. D. Protein expression analysis of PPP2R1B, PTEN, FOXO3a, or pFOXO3a by flow cytometry in CD4+ T cells treated with PPP2R1B and/or PTEN siRNAs and infected with a retrovirus expressing GFP only or Tat and eGFP. Results are reported as MFI. E. Level of apoptosis 48 h after Tat expression in CD4+ T-cells transduced with ns siRNA or PPP2R1B and/or PTEN siRNAs, or in CD4+ T-cells exposed to no inhibitor or 100 nM okadaic acid (a PP2A inhibitor) and then treated with PP2A enhancers (ceramide or FTY720). The mean ±SEM of two independent experiments is reported. (*) indicates p<0.05, (**) indicates p = 0.001. F. Level of apoptosis 48 h after HIV infection in CD4+ T-cells transduced with ns siRNA, PPP2R1B and/or PTEN siRNAs, untreated, treated with 100 nM okadaic acid (a PP2A inhibitor) or 10 nM bpV(HOpic) (a PTEN inhibitor). The mean ±SEM of two independent experiments is reported, (*) indicates p<0.05.
Figure 6
Figure 6. Apoptosis and PI3K pathway modulation in primary CD4+ T cells exposed to exogenous Tat.
A. Levels of apoptosis 24 and 48 hours after exposure to different Tat concentrations in the medium. B. Levels of apoptosis 24 and 48 hours after exposure to 5 µg/ml of Tat and inhibitors of PTEN (10 nM bpV(HOpic)), PP2A (100 nM okadaic acid), Akt (50 µM Akt1-1/2), and PI3K (10 nM LY294002). The means ± SEM of three experiments are shown. (*) indicates p<0.05, (**) indicates p = 0.001. C. RNA expression levels of different genes part of the PI3K pathway in primary CD4+ T cells exposed to exogenous Tat. D. Corresponding protein levels for the same genes that are part of the PI3K pathway in primary CD4+ T cells 24 hours after exposure to exogenous Tat. RT-PCR results are normalized to GAPDH and reported as fold induction relative to cells untreated control. The average and SEM of three independent experiments is reported. E. One representative flow cytometric protein analysis related to the data reported in D. Results are reported as fold increase of mean fluorescence intensity (MFI) relative to the untreated control.
Figure 7
Figure 7. Analysis of transcription initiation and elongation at the PTEN, PP2R1B and PPP2R5E promoters.
A. Schematic illustration of the location of amplified DNA (P1, P2, and P3) and RNA (E1, E2) fragments in the linear sequence of PTEN, PP2R1B and PPP2R5E genes. The transcriptional start site (TSS) is marked with a black box. Numbers in red mark the first nucleotide of the initiation codon. The promoter fragments used in B. start at the beginning of the individual lines and go to nucleotide −1. B. Luciferase activity in cells expressing Tat or Tat mutants and a luciferase gene under the control of PTEN (−1015 to−1), PPP2R1B (−1074 to−1), or PPP2R5E (−1000 to −1) promoters. C. Detection of PTEN, PP2R1B and PPP2R5E mRNA transcripts using primers in close proximity of (E1) or distant from (E2) the transcription start site. D. mRNA fold induction ratios between E1 and E2.
Figure 8
Figure 8. Tat-mediated alteration of apoptotic pathways regulated by FOXO3a.
Red lines indicate the association of the protein in the circle at the beginning of the line with the promoter of the factor at the end of the line and its increased transcription. Red arrows connect proteins whose level is increased by the factor indicated at the beginning of the line. The green line that connects PAK1 to FOXO3a indicates reduced levels of PAK1. A red X marks a step that is significantly reduced.

Similar articles

Cited by

References

    1. Dabrowska A, Kim N, Aldovini A. Tat-Induced Foxo3a Is A Key Mediator Of Apoptosis In Hiv-1-Infected Human Cd4+ T Lymphocytes. J Immunol. 2008;181:8460–8477. - PMC - PubMed
    1. Modur V, Nagarajan R, Evers Bm, Milbrandt J. Foxo Proteins Regulate Tumor Necrosis Factor-Related Apoptosis Inducing Ligand Expression. Implications For Pten Mutation In Prostate Cancer. J Biol Chem. 2002;277:47928–47937. - PubMed
    1. Sunters A, Fernandez De Mattos S, Stahl M, Brosens Jj, Zoumpoulidou G, et al. Foxo3a Transcriptional Regulation Of Bim Controls Apoptosis In Paclitaxel-Treated Breast Cancer Cell Lines. J Biol Chem. 2003;278:49795–49805. - PubMed
    1. Baron V, Adamson Ed, Calogero A, Ragona G, Mercola D. The Transcription Factor Egr1 Is A Direct Regulator Of Multiple Tumor Suppressors Including Tgfbeta1, Pten, P53, And Fibronectin. Cancer Gene Ther. 2006;13:115–124. - PMC - PubMed
    1. Virolle T, Adamson Ed, Baron V, Birle D, Mercola D, et al. The Egr-1 Transcription Factor Directly Activates Pten During Irradiation-Induced Signalling. Nat Cell Biol. 2001;3:1124–1128. - PubMed

Publication types

MeSH terms