. 2011 Jan;39(2):545-55.
doi: 10.1093/nar/gkq739. Epub 2010 Sep 21.

DNA is a co-factor for its own replication in Xenopus egg extracts

Affiliations

DNA is a co-factor for its own replication in Xenopus egg extracts

Ronald Lebofsky et al. Nucleic Acids Res. 2011 Jan.

Abstract

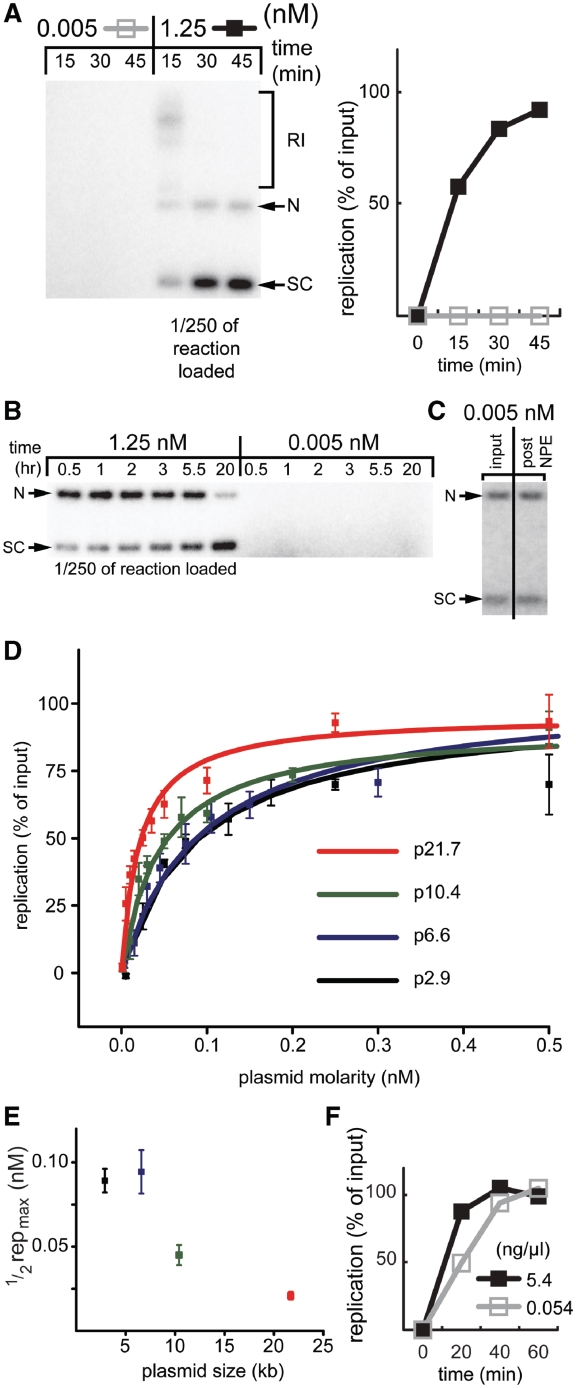
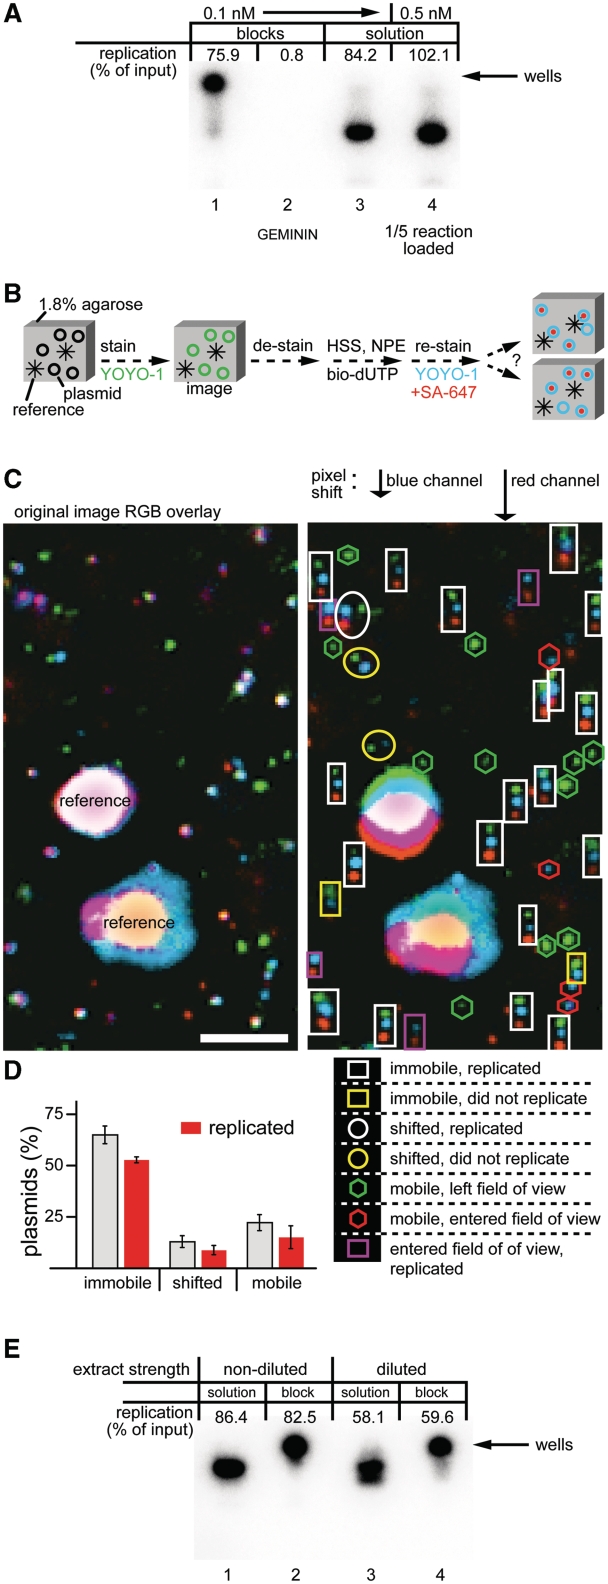
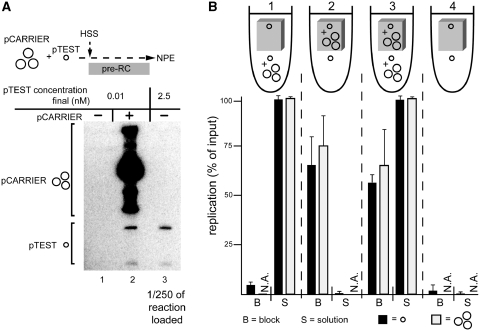
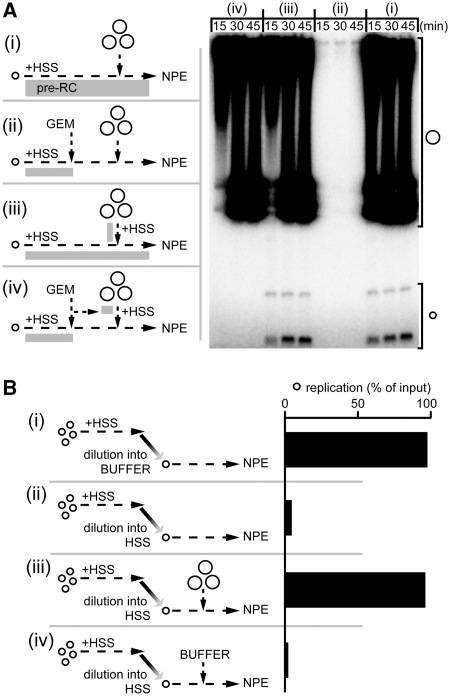
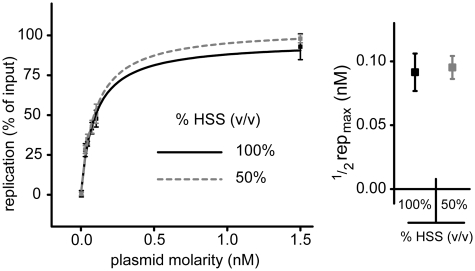
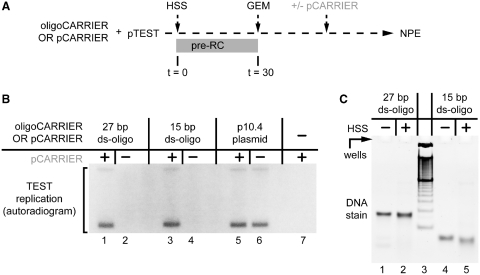
Soluble Xenopus egg extracts efficiently replicate added plasmids using a physiological mechanism, and thus represent a powerful system to understand vertebrate DNA replication. Surprisingly, DNA replication in this system is highly sensitive to plasmid concentration, being undetectable below ∼10 pM and highly efficient above ∼75 pM. DNA replication at the high plasmid concentration does not require plasmid-plasmid contacts, since replication is not inhibited when plasmids are immobilized in agarose prior to addition of egg extract. The absence of replication at low plasmid concentration is due to a defect in the assembly of pre-replication complexes (pre-RCs). pre-RC assembly requires contact-independent communication between plasmids. Our results show that in Xenopus egg extracts, aggregation of multiple replication forks is not required for efficient replication of plasmid DNA, and they suggest that DNA functions as a co-factor for its own duplication.


Figures

Figure 1.
Figure 1.
DNA replication is sensitive to plasmid concentration. (A) p2.9 was incubated in HSS at 0.015 or 3.75 nM final concentration. After 30 min, two volumes of NPE containing [α-32P]dATP were added, reducing the final DNA concentrations to 0.005 and 1.25 nM, respectively. At various times after NPE addition, replication products were separated on a native agarose gel and analyzed by autoradiography. To examine equivalent quantities of DNA from both reactions, only 1/250th of the 1.25 nM reaction was loaded. The signal above background from the entire lane was used to calculate the percentage of replication and the results are graphed on the right. See Walter and Newport (2000) (28) for an explanation of the different replication products. RI, replication intermediates; N, nicked products; SC, supercoiled products. (B) p2.9 was replicated as in (A), except that samples were analyzed for DNA replication at later time points. (C) Low concentration plasmids do not undergo degradation in HSS/NPE. Radiolabeled p2.9 (for radiolabeling, see experimental procedures) was incubated in HSS/NPE as described in (A). The 45-min time point was separated on a gel (right lane) alongside the input (left lane). (D) The effect of plasmid concentration on DNA replication efficiency for four different plasmids. Plasmids were replicated as described in (A). Replication was analyzed 90 min after NPE addition. Data from triplicate experiments were fit with y = replicationmax·[plasmid]/(K + [plasmid]) where K is ½ replicationmax. (E) The plasmid concentration that yields half maximal replication was derived from the curves in (D) and graphed. (F) Sperm chromatin was replicated as in (A) at a final concentration of 0.054 or 5.4 ng/µl and the replication efficiency in each condition was graphed.
Figure 2.
Figure 2.
Efficient DNA replication of immobilized plasmids. (A) The 1.8% agarose blocks (5 µl) containing 0.1 nM p10.4 were incubated with two volumes of HSS, with or without Geminin. After 30 min, the supernatant was exchanged with two volumes of NPE containing [α-32P]dATP. Reactions in solution containing a final concentration of 0.1 or 0.5 nM p10.4 were carried out in parallel. In all cases, DNA replication efficiency was determined 90 min after NPE addition. In lanes 1 and 2, the DNA was not released from the block and thus remained in the well, where the block was loaded. In lane 4, one-fifth of the 0.5 nM reaction was loaded. (B) Cartoon illustrating procedure to determine plasmid position and replication in an agarose block. (C) The 1.8% agarose blocks containing 0.1 nM p10.4 and 2.8 µm beads (to provide reference points) were prepared. Plasmids were stained with YOYO-1, photographed and de-stained. Subsequently, HSS was added, followed by NPE containing biotin-dUTP. After 90 min, the blocks were stained again with YOYO-1 and the biotin-dUTP was detected with AlexaFluor 647 conjugated streptavidin (SA-647). The same position in the block that was imaged before extract addition was located and images were acquired by fluorescence microscopy. The green and blue channels represent the initial and final plasmid positions as determined by YOYO-1 staining, respectively. The red channel represents SA-647 staining of incorporated biotin-dUTP. The blue and red channels were shifted in the y-axis to facilitate analysis. Plasmid classification is shown below the shifted image. (bar = 5 µm) (D) The average percentage of plasmids that was immobile, shifted, or mobile from eight areas of a single block was calculated and graphed. The subset of plasmids in each group that replicated is shown in red. Error bars indicate the standard deviation of the eight areas that were scanned. (E) Replication in diluted extracts. p10.4 (0.1 nM) was replicated in agarose blocks or in solution as described in (A). In the ‘diluted’ condition, HSS and NPE were each diluted 5- and 4-fold with ELB, respectively.
Figure 3.
Figure 3.
One plasmid activates replication of another in trans. (A) The effect of pCARRIER on pTEST plasmid replication in solution. In lane 2, pTEST (p2.9, single small circle) and pCARRIER (p10.4, group of large circles) were premixed and incubated in HSS at 0.03 and 1.5 nM final concentrations, respectively. In lanes 1 and 3, only pTEST was incubated in HSS (0.03 and 7.5 nM, respectively). Ninety minutes after addition of two volumes NPE, DNA replication was analyzed by gel electrophoresis and autoradiography. In lane 3, 1/250th of the total reaction was loaded. (B) Effect of pCARRIER on replication of pTEST plasmid in agarose blocks. The 1.8% agarose blocks (5 µl volume) were prepared containing pTEST (p2.9, 0.01 nM) with or without pCARRIER (p10.4, 0.5 nM). HSS was incubated with pCARRIER (p10.4, 1.5 nM final concentration) and pTEST (p2.9, 0.03 nM) or pTEST alone (p2.9, 0.03 nM) for 7.5 min. Ten microlitre of the extract/DNA mixture was then added to the agarose blocks. Relative to the entire HSS/block volume, two volumes of NPE containing [α-32P]dATP were added. At 90 min, the blocks were digested with agarase, and the released replication products were separated on an agarose gel alongside the DNA from the supernatants. Results from three independent experiments were quantified and the averages and standard deviations are graphed below a cartoon of each condition.
Figure 4.
Figure 4.
Two steps in replication are sensitive to plasmid concentration. (A) Licensing fails at low plasmid concentration. As indicated by the cartoons (i–iv), pTEST plasmid (p2.9, single small circle) was incubated with HSS and then subjected to four different reaction schemes. In scheme (i), after 30 min, pCARRIER (p10.4, group of large circles) was added followed within another 30 min by NPE. (ii), same as (i), except that Geminin was added 10 min before pCARRIER addition. (iii), same as in (i) except that pCARRIER was incubated for 30 min separately in HSS before being added to pTEST/HSS. (iv), same as (iii) except that Geminin was added for 10 min to pTEST and pCARRIER before they were mixed. Before addition of two volumes of NPE, the concentration in HSS of pTEST was 0.015 nM and of pCARRIER was 0.65 nM. At the indicated times after NPE addition, the replication products were separated by gel electrophoresis as shown on the right. (B) (i and ii) HSS inhibits events downstream of licensing at low DNA concentration. As illustrated on the left, pTEST (p2.9; group of small circles) was incubated in HSS at a concentration of 3 nM for 30 min followed by a 200-fold dilution into buffer (i) or HSS (ii) prior to addition of two volumes of NPE containing [α-32P]dATP. Replication was measured by gel electrophoresis and autoradiography 60 min after NPE addition, and results are graphed on the right. (iii and iv) pCARRIER neutralizes the inhibitory effect of HSS on post-licensing events. pTEST (p2.9, group of small circles) was incubated at a concentration of 1.5 nM in HSS for 30 min, followed by a 100-fold dilution in fresh HSS. p10.4 CARRIER DNA at a final concentration of 0.65 nM (iii) or buffer (iv) was added after the dilution in HSS, and prior to addition of NPE. The replication products were analyzed as in (Bi, ii).
Figure 5.
Figure 5.
HSS dilution does not rescue replication at low DNA concentration. p6.6 was incubated for 30 min in 100% HSS or HSS diluted 50% v/v with buffer, followed by NPE addition. Replication was analyzed 90 min after NPE addition. Data from triplicate experiments were fit with y = replicationmax · [plasmid] / (K + [plasmid]) where K is ½ replicationmax. The p6.6 concentration that produces half-maximal replication was derived from the curves and graphed on the right.
Figure 6.
Figure 6.
Short double-stranded oligonucleotides stimulate licensing. (A) Scheme to determine rescue of pTEST licensing. pCARRIER or oligoCARRIER was premixed with pTEST and incubated in HSS. After 30 min, Geminin was added, and after a further 10 min the reaction was supplemented with pCARRIER or buffer (p10.4, 1 nM, grey lettering to indicate post-GEMININ addition), followed by NPE. (B) Effect of oligoCARRIER on pTEST licensing. HSS containing pTEST (p2.9, 0.01 nM) was supplemented with a 27-bp duplex oligo (lanes 1 and 2, 20 ng/µl, 1.1 µM), 15-bp duplex oligo (lanes 3 and 4, 20 ng/µl, 2.0 µM), or pCARRIER (p10.4) (lanes 5 and 6, 20 ng/µl, 2.9 nM). Thereafter, the experiment proceeded as described in (A). Ninety minutes after NPE, the replication products were separated by gel electrophoresis and quantified by autoradiography. (C) Just prior to Geminin addition, the DNA/HSS mix from the 27- and 15-bp duplex oligo samples described in Figure 6B were treated with RNAse, phenol–chloroform extracted, separated by native PAGE, and imaged with Sybr-Gold staining (right gel, lanes 2 and 5), alongside input DNA minus HSS (lanes 1 and 4) and a 10-bp ladder (lane 3).

Similar articles

Cited by

References

    1. Takeda DY, Dutta A. DNA replication and progression through S phase. Oncogene. 2005;24:2827–2843. - PubMed
    1. Bell SP, Dutta A. DNA replication in eukaryotic cells. Annu. Rev. Biochem. 2002;71:333–374. - PubMed
    1. Arias EE, Walter JC. Strength in numbers: preventing rereplication via multiple mechanisms in eukaryotic cells. Genes Dev. 2007;21:497–518. - PubMed
    1. Blow JJ, Dutta A. Preventing re-replication of chromosomal DNA. Nat. Rev. Mol. Cell Biol. 2005;6:476–486. - PMC - PubMed
    1. Diffley JF. DNA replication: building the perfect switch. Curr. Biol. 2001;11:R367–R370. - PubMed

Publication types