

Electrocardiographic changes with the onset of diabetes and the impact of aerobic exercise training in the Zucker Diabetic Fatty (ZDF) rat
- PMID: 20860788
- PMCID: PMC2954909
- DOI: 10.1186/1475-2840-9-56
Electrocardiographic changes with the onset of diabetes and the impact of aerobic exercise training in the Zucker Diabetic Fatty (ZDF) rat
Abstract
Background: Early markers of diabetic autonomic neuropathy (DAN) in an electrocardiogram (ECG) include elevated R wave amplitudes, widening of QTc intervals and decreased heart rate variability (HRV). The severity of DAN has a direct relationship with mortality risk. Aerobic exercise training is a common recommendation for the delay and possible reversal of cardiac dysfunction. Limited research exists on ECG measures for the evaluation of aerobic exercise training in Zucker Diabetic Fatty (ZDF) rat, a model of type 2 diabetes. The objective of this study was to assess whether aerobic exercise training may attenuate diabetes induced ECG changes.
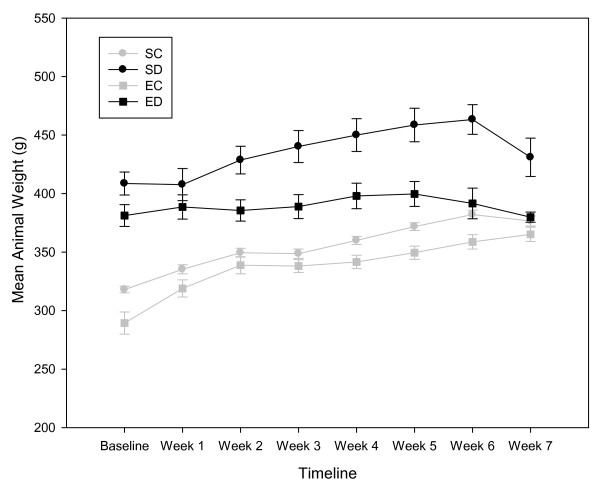
Methods: Male ZDF (obese fa/fa) and control Zucker (lean fa/+) rats were assigned to 4 groups: sedentary control (SC), sedentary diabetic (SD), exercised control (EC) and exercised diabetic (ED). The exercised groups began 7 weeks of treadmill training after the development of diabetes in the ED group. Baseline (prior to the training) and termination measurements included body weight, heart weight, blood glucose and glycated hemoglobin levels and ECG parameters. One way repeated measures ANOVA (group) analyzed within and between subject differences and interactions. Pearson coefficients and descriptive statistics described variable relationships and animal characteristics.
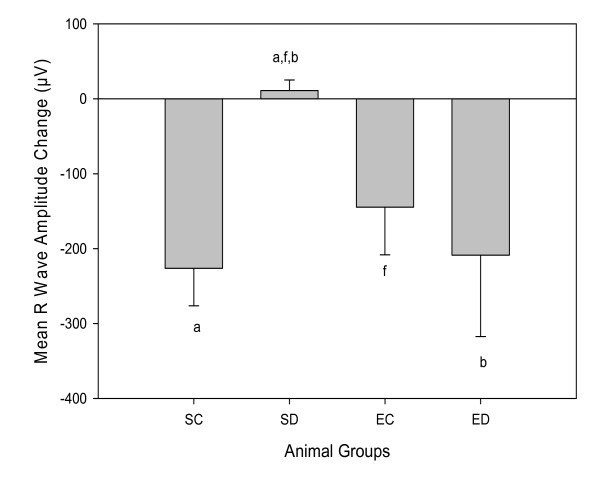
Results: Diabetes caused crucial changes in R wave amplitudes (p < 0.001), heart rate variability (p < 0.01), QT intervals (p < 0.001) and QTc intervals (p < 0.001). R wave amplitude augmentation in SD rats from baseline to termination was ameliorated by exercise, resulting in R wave amplitude changes in ED animals similar to control rats. Aerobic exercise training neither attenuated QT or QTc interval prolongation nor restored decreases in HRV in diabetic rats.
Conclusion: This study revealed alterations in R wave amplitudes, HRV, QT and QTc intervals in ZDF rats. Of these changes, aerobic exercise training was able to correct R wave amplitude changes. In addition, exercise has beneficial effect in this diabetic rat model in regards to ECG correlates of left ventricular mass.
Figures
Similar articles
-
Effects of obesity and diabesity on heart rhythm in the Zucker rat.Clin Exp Pharmacol Physiol. 2021 May;48(5):735-747. doi: 10.1111/1440-1681.13473. Epub 2021 Feb 20. Clin Exp Pharmacol Physiol. 2021. PMID: 33609055
-
Exercise Training Attenuates the Development of Cardiac Autonomic Dysfunction in Diabetic Rats.In Vivo. 2018 Nov-Dec;32(6):1433-1441. doi: 10.21873/invivo.11396. In Vivo. 2018. PMID: 30348698 Free PMC article.
-
Heart rate variability modifications following exercise training in type 2 diabetic patients with definite cardiac autonomic neuropathy.Br J Sports Med. 2008 Jan;42(1):47-54. doi: 10.1136/bjsm.2007.035303. Epub 2007 May 25. Br J Sports Med. 2008. PMID: 17526623
-
Mechanisms underlying electro-mechanical dysfunction in the Zucker diabetic fatty rat heart: a model of obesity and type 2 diabetes.Heart Fail Rev. 2020 Sep;25(5):873-886. doi: 10.1007/s10741-019-09872-4. Heart Fail Rev. 2020. PMID: 31654177 Review.
-
Diabetic complications in obese type 2 diabetic rat models.Exp Anim. 2014;63(2):121-32. doi: 10.1538/expanim.63.121. Exp Anim. 2014. PMID: 24770637 Free PMC article. Review.
Cited by
-
Chronic Running Exercise Alleviates Early Progression of Nephropathy with Upregulation of Nitric Oxide Synthases and Suppression of Glycation in Zucker Diabetic Rats.PLoS One. 2015 Sep 17;10(9):e0138037. doi: 10.1371/journal.pone.0138037. eCollection 2015. PLoS One. 2015. PMID: 26379244 Free PMC article.
-
Diabetes and Arrhythmias: Pathophysiology, Mechanisms and Therapeutic Outcomes.Front Physiol. 2018 Nov 26;9:1669. doi: 10.3389/fphys.2018.01669. eCollection 2018. Front Physiol. 2018. PMID: 30534081 Free PMC article. Review.
-
The ECG vertigo in diabetes and cardiac autonomic neuropathy.Exp Diabetes Res. 2011;2011:687624. doi: 10.1155/2011/687624. Epub 2011 May 29. Exp Diabetes Res. 2011. PMID: 21747831 Free PMC article. Review.
-
Caloric restriction, physical exercise, and CB1 receptor blockade as an efficient combined strategy for bodyweight control and cardiometabolic status improvement in male rats.Sci Rep. 2021 Feb 19;11(1):4286. doi: 10.1038/s41598-021-83709-9. Sci Rep. 2021. PMID: 33608628 Free PMC article.
-
The effects of crocin, insulin and their co-administration on the heart function and pathology in streptozotocin-induced diabetic rats.Avicenna J Phytomed. 2016 Nov-Dec;6(6):658-670. Avicenna J Phytomed. 2016. PMID: 28078246 Free PMC article.
References
-
- Christensen PK, Gall MA, Major-Pedersen A, Sato A, Rossing P, Breum L, Pietersen A, Kastrup J, Parving HH. QTc interval length and QT dispersion as predictors of mortality in patients with non-insulin-dependent diabetes. Scand J Clin Lab Invest. 2000;60(4):323–332. doi: 10.1080/003655100750046486. - DOI - PubMed
-
- Mathur C, Gupta D. QTc prolongation in diabetes mellitus-An indicator of cardiac autonomic neuropathy. Journal, Indian Academy Clinical Medicine. 2006;7(2):130–132.
Publication types
MeSH terms
Grants and funding
LinkOut - more resources
Full Text Sources
Medical
Miscellaneous
