. 2010 Nov 26;285(48):37445-57.
doi: 10.1074/jbc.M110.125542. Epub 2010 Sep 21.

Mutant huntingtin alters cell fate in response to microtubule depolymerization via the GEF-H1-RhoA-ERK pathway

Affiliations

Mutant huntingtin alters cell fate in response to microtubule depolymerization via the GEF-H1-RhoA-ERK pathway

Hemant Varma et al. J Biol Chem. .

Abstract

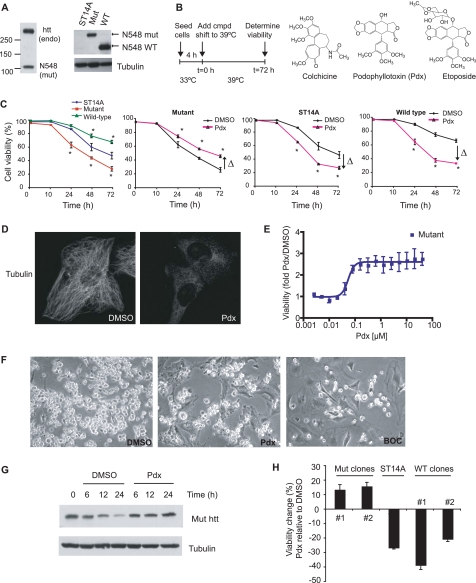
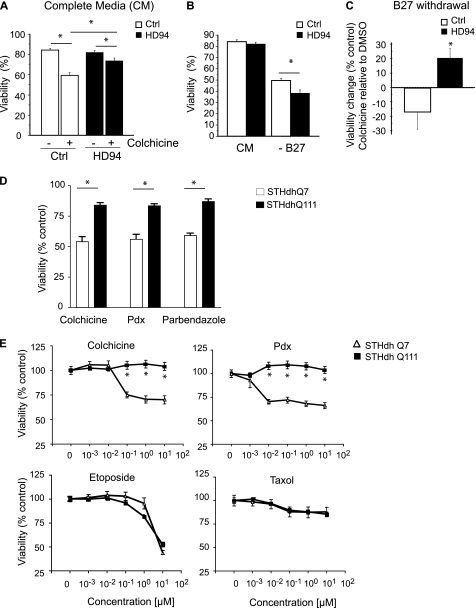
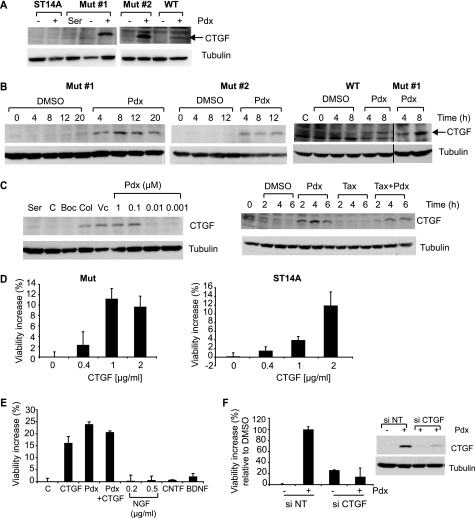
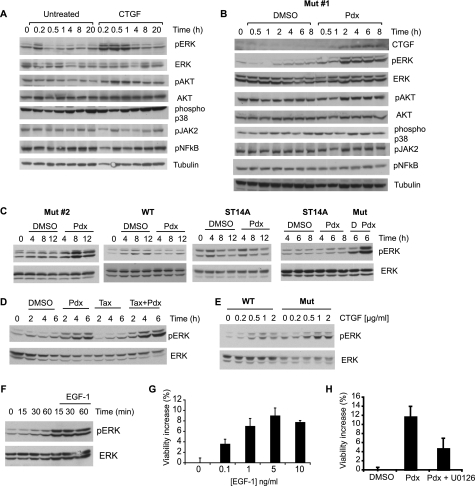
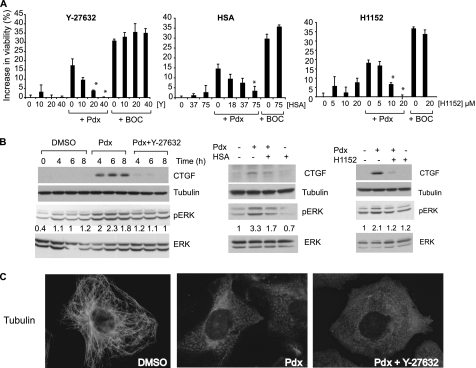
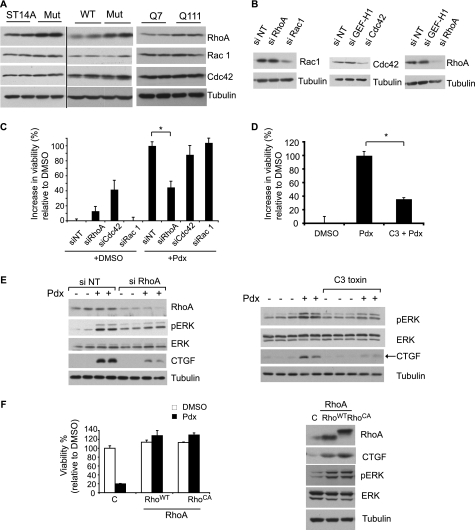
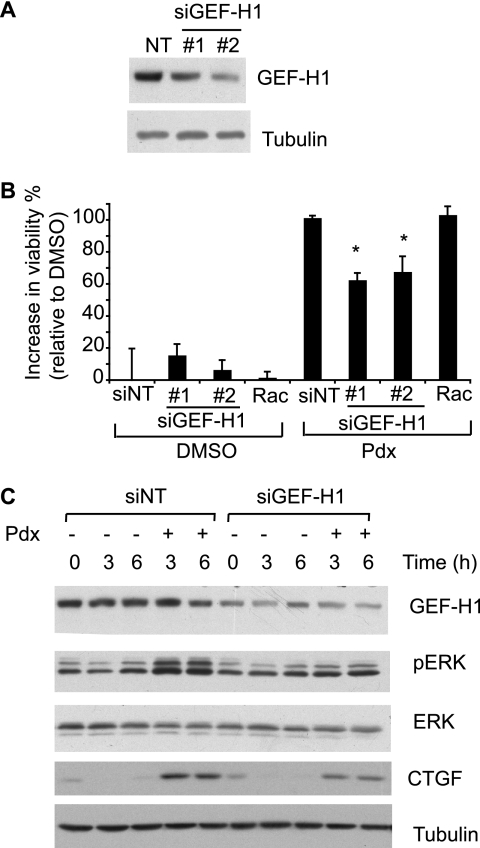
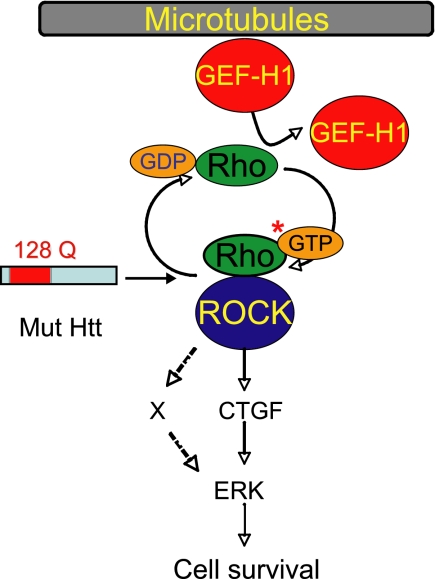
Cellular responses to drug treatment show tremendous variations. Elucidating mechanisms underlying these variations is critical for predicting therapeutic responses and developing personalized therapeutics. Using a small molecule screening approach, we discovered how a disease causing allele leads to opposing cell fates upon pharmacological perturbation. Diverse microtubule-depolymerizing agents protected mutant huntingtin-expressing cells from cell death, while being toxic to cells lacking mutant huntingtin or those expressing wild-type huntingtin. Additional neuronal cell lines and primary neurons from Huntington disease mice also showed altered survival upon microtubule depolymerization. Transcription profiling revealed that microtubule depolymerization induced the autocrine growth factor connective tissue growth factor and activated ERK survival signaling. The genotype-selective rescue was dependent upon increased RhoA protein levels in mutant huntingtin-expressing cells, because inhibition of RhoA, its downstream effector, Rho-associated kinase (ROCK), or a microtubule-associated RhoA activator, guanine nucleotide exchange factor-H1 (GEF-H1), all attenuated the rescue. Conversely, RhoA overexpression in cells lacking mutant huntingtin conferred resistance to microtubule-depolymerizer toxicity. This study elucidates a novel pathway linking microtubule stability to cell survival and provides insight into how genetic context can dramatically alter cellular responses to pharmacological interventions.


Figures

FIGURE 1.
FIGURE 1.
MT depolymerizers rescue mutant htt cell death. A, full-length endogenous WT (endo) and mutant htt (N-terminal 548-amino acid) fragment were detected by Western blotting using the MAB2166 antibody in mutant htt cells (left panel). Mutant htt fragment has decreased electrophoretic mobility compared with the WT htt fragment due to more polyglutamine repeats (Gln128 in mutant versus Gln15 in WT htt, right panel). B, schematic of the design of high-throughput screen. 1,500 cells were plated per well in 384-well plates in serum-deprived medium. After 4 h at 33 °C the cells were shifted to 39 °C. The shift to 39 °C is time (t) 0 for determining cell viability. Structures of two MT-depolymerizing agents (colchicine and podophyllotoxin (Pdx)), and the topoisomerase inhibitor etoposide, a structural analog of Pdx (right panel) are shown. C, mutant, WT htt, and parental ST14A cells were serum deprived and cell viability was assayed by trypan blue dye exclusion assay (left panel). In parallel, these cell lines were serum deprived, treated with Pdx (400 nm), and cell viability determined at the indicated time points. The data are the average ± S.D. for an experiment performed in duplicate. Arrows indicate the direction of change (Δ) in viability of Pdx treated, relative to DMSO (0.1%) treated cells (*, p < 0.05 Student's t test). D, tubulin immunofluorescence in mutant htt cells treated with DMSO or Pdx (400 nm) for 6 h. E, cell viability of a dose dilution of Pdx-treated relative to DMSO-treated mutant htt cells was determined by calcein AM assay, a fluorescence based viability assay (see “Experimental Procedures”). The assay was performed 3 days after serum deprivation. The data are the mean ± S.D. of an experiment performed in triplicate. F, phase-contrast images of mutant htt cells treated with DMSO, Pdx (400 nm), or the pan-caspase inhibitor BOC-D-fmk (BOC, 50 μm) for 2 days. Dying cells detach and are rounded and brighter than live cells. We confirmed that detached, rounded cells were mostly dead (94%) compared with 17% cell death in attached cells using the trypan blue dye exclusion assay. G, cells were treated with DMSO or Pdx (400 nm) over 24 h and mutant htt protein levels were determined by Western blotting. H, cell viability change due to Pdx treatment was determined in parental cells and two N548 mutant and WT htt fragment expressing clones. Cells were incubated at 33 °C overnight, treated with Pdx (400 nm) in SDM, and viability was determined after 3 days at 39 °C. Data are the mean ± S.D. of an experiment in duplicate.
FIGURE 2.
FIGURE 2.
Diverse HD models demonstrate altered sensitivity to MT depolymerization. A, primary striatal neurons from HD mice (HD94) are more resistant to colchicine-induced toxicity than control neurons. After 16 days in vitro (DIV16) neurons were administered colchicine (10 μm) or vehicle (DMSO) and cell death was assessed 96 h later (see “Experimental Procedures”). Colchicine was significantly less toxic to HD94 neurons (analysis of variance, p = 0.0006) (*, p < 0.05). B, B27 (medium supplement) withdrawal is more toxic in HD94 neurons than control neurons: medium from DIV14 neurons was exchanged with complete medium or medium lacking B27, and assessed for cell death 48 h later. Fisher post hoc analysis revealed that under complete medium (CM), cell death was comparable in control (Ctrl) and HD94 neurons (p = 0.3276). B27 withdrawal decreased viability in both genotypes (p < 0.0001); however, it was significantly more toxic in HD94 neurons than control (*, p = 0.0074). C, medium from DIV14 neurons was exchanged with medium lacking B27 in the presence or absence of colchicine (0.1 μm) and cell viability was assessed 48 h later. Viability is shown relative to DMSO-treated cells. Analysis of variance revealed B27 withdrawal induced toxicity was significantly (*, p < 0.05) suppressed by colchicine treatment in HD94, but not in control neurons. D, immortalized striatal neurons from HD knock-in mice (WT, STHdhQ7, and mutant, STHdhQ111) were treated with DMSO or various MT inhibitors, each at 2.5 μm, and cell viability was determined after 24 h using a luminescence-based ATP assay (see “Experimental Procedures”). Cell viability was normalized to DMSO-treated STHdhQ7 and STHdhQ111 cells and the data are the mean ± S.E., of an experiment performed in triplicate. E, STHdhQ7 and STHdhQ111 were treated with a dilution series of colchicine, Pdx, etoposide, or Taxol and viability was determined as in D. Data are the mean ± S.E. of an experiment performed in triplicate (*, p < 0.05 Student's t test).
FIGURE 3.
FIGURE 3.
MT depolymerization-induced CTGF up-regulation rescues cell death. A, CTGF protein levels were monitored by Western blotting in parental ST14A cells, two mutant htt-expressing (Mut) cell lines, and a WT htt-expressing cell line with or without Pdx (400 nm) treatment for 6 h in SDM. Mutant cells in 10% serum containing medium (Ser) served as a control for no cell death. Tubulin was used as a loading control. B, CTGF protein levels were determined at the indicated times after Pdx (400 nm) treatment in two N548 mutant htt expressing clones (Mut#1 and Mut#2) and in the comparable N548 WT htt cell line. WT htt cells in 10% serum served as controls (C). C, mutant htt cells were in serum-containing medium (Ser) or were serum-deprived and treated with vehicle DMSO (C), caspase inhibitor BOC-D-fmk (Boc, 50 μm), colchicine (Col, 1 μm), vincristine (Vc, 1 μm), and a dose series of Pdx. CTGF levels were determined by Western blotting after 6 h (left panel). Mutant htt cells were treated with Pdx (400 nm) or Taxol (1 μm) alone, or in combination, and CTGF levels were monitored by Western blotting (right panel). D, mutant htt or parental cells were treated with recombinant CTGF and cell viability was assessed after 2 days in SDM. Data are mean ± S.D. of an experiment performed in duplicate and representative of two independent experiments. E, mutant htt cells were treated with CTGF (1 μg/ml), Pdx (400 nm), CTGF (1 μg/ml) + Pdx (400 nm), nerve growth factor (NGF, 0.5 μg/ml), ciliary neurotrophic growth factor (CNTF, 0.2 μg/ml), or BDNF (0.2 μg/ml) and cell viability was determined after 2 days in SDM. F, mutant htt cells were transfected with non-targeting (NT) or CTGF siRNA for 2 days, and medium was changed to SDM with DMSO or Pdx (400 nm). Cell viability was determined after an additional 2 days and expressed on a scale relative to DMSO set as 0% and Pdx as 100%. Data are mean ± S.D. of an experiment performed in duplicate and representative of two independent experiments. In parallel, mutant htt cells transfected with indicated siRNAs were treated with Pdx (400 nm) or DMSO for 6 h and CTGF levels were determined by Western blotting. Tubulin was a loading control.
FIGURE 4.
FIGURE 4.
ERK survival signaling is activated by CTGF and MT depolymerization in mutant htt cells. A, mutant htt cells were treated with CTGF (1 μg/ml), or untreated in SDM, and the activity of diverse signaling pathways was monitored by Western blotting using phosphospecific antibodies. B, mutant htt cells were treated with DMSO or Pdx (400 nm), and CTGF levels and activity of several signaling pathways were monitored by Western blotting using phosphospecific antibodies. C, Pdx selectively activates ERK in mutant htt but not in ST14A or WT htt cells. Mutant htt clone 2 (Mut#2), WT htt and ST14A cells were treated with DMSO (D) or Pdx (400 nm) under non-permissive conditions and ERK activity was determined using a phospho-ERK specific antibody. D, mutant htt cells were treated with Pdx (400 nm) or Taxol (1 μm) alone, or in combination. ERK activity was monitored using Western blotting. E, WT htt cells show attenuated ERK activation upon CTGF treatment. Mutant htt and WT htt cells were treated with a dose dilution of CTGF and ERK activity was monitored after a 1-h treatment. F, mutant htt cells were untreated or treated with EGF-1 (5 ng/ml) and ERK activity was monitored using a phospho-ERK specific antibody. G, dose response for increase in mutant htt cell viability upon EGF-1 treatment. Viability was determined using trypan blue dye exclusion assay after under 2 days in SDM. H, mutant htt cells were treated with Pdx (400 nm) alone or with U0126 (0.5 μg/ml), an inhibitor of ERK activation, and cell viability was determined after 2 days in SDM as in G. Data are mean ± S.D. of an experiment performed in duplicate.
FIGURE 5.
FIGURE 5.
Rho kinase (ROCK) inhibitors suppress rescue upon MT depolymerization. A, mutant htt cells were treated with a dilution series of three ROCK inhibitors Y-27632 (Y), hydroxyfasudil (HSA), or H1152 alone or in combination with Pdx (400 nm) or BOC-D-fmk (BOC, 50 μm) and cell viability was determined by a trypan blue dye exclusion assay. The increase in cell viability relative to DMSO-treated cells was determined after 2 days in SDM. Data are the mean ± S.D. of an experiment performed in duplicate. (*, p < 0.05, Student's t test). B, mutant htt cells were treated with DMSO, Pdx (400 nm), or Pdx (400 nm) in combination with individual ROCK inhibitors (Y-27632, 40 μm; hydroxyfasudil (HSA), 75 μm; H1152, 20 μm) and levels of CTGF, phosphorylated and total ERK were determined by Western blotting at the indicated time points for Y-27632, or 6 h after treatment, for hydroxyfasudil and H1152 treatments. Tubulin was a loading control. The experiments are representative of at least two independent experiments for each treatment. pERK and ERK were quantitated using Image J (NIH) and the level of pERK was normalized to ERK and the 6-h time in SDM was set as 1 in each treatment. pERK levels relative to the 6-h time point are provided below the blots. C, mutant htt cells were treated with DMSO, Pdx (400 nm), or Pdx (400 nm) + Y-27632 (40 μm) and the tubulin network was visualized by immunofluorescence 6 h after treatment.
FIGURE 6.
FIGURE 6.
RhoA signaling is required for rescue induced by MT depolymerization. A, the levels of Rho GTPases in parental ST14A, WT, and mutant htt cells (left and middle panels) and in STHdhQ7 and STHdhQ111 cells were determined by Western blotting (right panel). Tubulin was the loading control. B, mutant htt cells were transfected either with siRNA oligonucleotides directed against the indicated Rho GTPases or a non-targeting (NT) siRNA pool, and the levels of the respective proteins were assessed by Western blotting. C, mutant htt cells were transfected with the indicated siRNAs for 2 days, and the medium was changed to SDM with DMSO or Pdx (400 nm). Cell viability was determined after an additional 2 days and expressed on a scale relative to DMSO set as 0% and Pdx as 100% (*, p < 0.05, Student's t test). D, mutant htt cells were treated with Pdx (400 nm) alone or in combination with C3 Rho inhibitor (2 μg/ml) and cell viability was determined as in C (*, p < 0.05, Student's t test). E, mutant htt cells were either transfected with siRNA or treated with C3 transferase. The cells were then treated with Pdx (400 nm) or DMSO in duplicate for 4 h and the levels of the indicated proteins determined by Western blotting. F, ST14A cells were lentivirally transduced with expression vectors for control (puromycin resistance gene), WT (RhoAWT), or a constitutive active RhoA (RhoACA), and incubated for 2 days at 33 °C. Cell viability was determined after an additional 2 days of serum deprivation at 39 °C with or without Pdx (400 nm) treatment (left panel). RhoA, CTGF, pERK, and ERK levels were determined by Western blotting. RhoACA has lower electrophoretic mobility compared with RhoAWT. Tubulin was a loading control (right panel).
FIGURE 7.
FIGURE 7.
GEF-H1 knockdown attenuates MT depolymerization-induced survival. A, mutant htt cells were transfected with two distinct siRNAs directed against GEF-H1 (#1 and #2) or equal amounts of non-targeting siRNA pool (NT) and the knockdown assessed by Western blotting. B, mutant htt cells were transfected with the indicated siRNAs for 2 days and the medium was changed to SDM with DMSO or Pdx (400 nm). Cell viability was determined after an additional 2 days and expressed on a scale relative to DMSO (0%) and Pdx (100%). Both non-targeting (NT) and Rac-1 siRNAs served as negative controls. Data are mean ± S.D. of an experiment performed in duplicate and representative of two independent experiments (*, p < 0.05, Student's t test). C, mutant htt cells were transfected with GEF-H1 (siRNA #1) or NT siRNA. Transfected cells were treated with Pdx (400 nm) or DMSO for the indicated times and levels of the indicated proteins were determined by Western blotting. The results are representative of two independent experiments.
FIGURE 8.
FIGURE 8.
Model of the cell survival pathway activated in mutant htt cells upon MT depolymerization. MT depolymerization releases GEF-H1 that activates RhoA by inducing exchange of GTP for GDP on RhoA. GTP-bound RhoA activates downstream ROCK, which up-regulates CTGF and activates ERK survival signaling. It is possible that mediators (X), in addition to CTGF, link GEF-H1-Rho-ROCK to ERK.

Similar articles

Cited by

References

    1. Evans W. E., Relling M. V. (2004) Nature 429, 464–468 - PubMed
    1. Makaryus J. N., Catanzaro J. N., Katona K. C. (2007) Hematology 12, 349–352 - PubMed
    1. Picard C., Casanova J. L., Abel L. (2006) Curr. Opin. Immunol. 18, 383–390 - PubMed
    1. Ogawa M., Miyakawa T., Nakamura K., Kitano J., Furushima K., Kiyonari H., Nakayama R., Nakao K., Moriyoshi K., Nakanishi S. (2007) Proc. Natl. Acad. Sci. U.S.A. 104, 14789–14794 - PMC - PubMed
    1. Bell J. (2004) Nature 429, 453–456 - PubMed

Publication types

MeSH terms

LinkOut - more resources