Comparison of sequencing-based methods to profile DNA methylation and identification of monoallelic epigenetic modifications
- PMID: 20852635
- PMCID: PMC2955169
- DOI: 10.1038/nbt.1682
Comparison of sequencing-based methods to profile DNA methylation and identification of monoallelic epigenetic modifications
Abstract
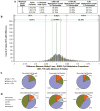
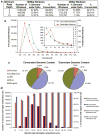
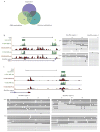
Analysis of DNA methylation patterns relies increasingly on sequencing-based profiling methods. The four most frequently used sequencing-based technologies are the bisulfite-based methods MethylC-seq and reduced representation bisulfite sequencing (RRBS), and the enrichment-based techniques methylated DNA immunoprecipitation sequencing (MeDIP-seq) and methylated DNA binding domain sequencing (MBD-seq). We applied all four methods to biological replicates of human embryonic stem cells to assess their genome-wide CpG coverage, resolution, cost, concordance and the influence of CpG density and genomic context. The methylation levels assessed by the two bisulfite methods were concordant (their difference did not exceed a given threshold) for 82% for CpGs and 99% of the non-CpG cytosines. Using binary methylation calls, the two enrichment methods were 99% concordant and regions assessed by all four methods were 97% concordant. We combined MeDIP-seq with methylation-sensitive restriction enzyme (MRE-seq) sequencing for comprehensive methylome coverage at lower cost. This, along with RNA-seq and ChIP-seq of the ES cells enabled us to detect regions with allele-specific epigenetic states, identifying most known imprinted regions and new loci with monoallelic epigenetic marks and monoallelic expression.
Conflict of interest statement
COMPETING INTERESTS STATEMENT
The authors declare no competing financial interests.
Figures


Comment in
-
Taking the measure of the methylome.Nat Biotechnol. 2010 Oct;28(10):1026-8. doi: 10.1038/nbt1010-1026. Nat Biotechnol. 2010. PMID: 20944589
Similar articles
-
Analyzing the cancer methylome through targeted bisulfite sequencing.Cancer Lett. 2013 Nov 1;340(2):171-8. doi: 10.1016/j.canlet.2012.10.040. Epub 2012 Nov 28. Cancer Lett. 2013. PMID: 23200671 Free PMC article. Review.
-
Estimating absolute methylation levels at single-CpG resolution from methylation enrichment and restriction enzyme sequencing methods.Genome Res. 2013 Sep;23(9):1541-53. doi: 10.1101/gr.152231.112. Epub 2013 Jun 26. Genome Res. 2013. PMID: 23804401 Free PMC article.
-
Comprehensive Whole DNA Methylome Analysis by Integrating MeDIP-seq and MRE-seq.Methods Mol Biol. 2018;1708:209-246. doi: 10.1007/978-1-4939-7481-8_12. Methods Mol Biol. 2018. PMID: 29224147 Free PMC article.
-
Combining MeDIP-seq and MRE-seq to investigate genome-wide CpG methylation.Methods. 2015 Jan 15;72:29-40. doi: 10.1016/j.ymeth.2014.10.032. Epub 2014 Nov 6. Methods. 2015. PMID: 25448294 Free PMC article.
-
Genome-scale DNA methylation analysis.Epigenomics. 2010 Feb;2(1):105-17. doi: 10.2217/epi.09.35. Epigenomics. 2010. PMID: 20657796 Free PMC article. Review.
Cited by
-
Analyzing the cancer methylome through targeted bisulfite sequencing.Cancer Lett. 2013 Nov 1;340(2):171-8. doi: 10.1016/j.canlet.2012.10.040. Epub 2012 Nov 28. Cancer Lett. 2013. PMID: 23200671 Free PMC article. Review.
-
What can epigenomics do for you?Genome Biol. 2012 Oct 23;13(10):420. doi: 10.1186/gb-2012-13-10-420. Genome Biol. 2012. PMID: 23095436 Free PMC article. No abstract available.
-
"Seq-ing" insights into the epigenetics of neuronal gene regulation.Neuron. 2013 Feb 20;77(4):606-23. doi: 10.1016/j.neuron.2013.01.034. Neuron. 2013. PMID: 23439116 Free PMC article. Review.
-
Bridging the Gap between DNA Methylation, DNA Methylation Readers, and Neurodevelopmental Disorders.J Neurosci. 2016 Jun 29;36(26):6851-3. doi: 10.1523/JNEUROSCI.1130-16.2016. J Neurosci. 2016. PMID: 27358443 Free PMC article. Review. No abstract available.
-
Global DNA methylation profiling reveals new insights into epigenetically deregulated protein coding and long noncoding RNAs in CLL.Clin Epigenetics. 2016 Oct 12;8:106. doi: 10.1186/s13148-016-0274-6. eCollection 2016. Clin Epigenetics. 2016. PMID: 27777635 Free PMC article.
References
-
- Robertson KD. DNA methylation and human disease. Nat Rev Genet. 2005;6:597–610. - PubMed
-
- Bird A. DNA methylation patterns and epigenetic memory. Genes Dev. 2002;16:6–21. - PubMed
-
- Feinberg AP, Vogelstein B. Hypomethylation distinguishes genes of some human cancers from their normal counterparts. Nature. 1983;301:89–92. - PubMed
-
- Gama-Sosa MA, Midgett RM, Slagel VA, Githens S, Kuo KC, Gehrke CW, et al. Tissue-specific differences in DNA methylation in various mammals. Biochim Biophys Acta. 1983;740:212–9. - PubMed
Publication types
MeSH terms
Substances
Grants and funding
- R01 DK081557/DK/NIDDK NIH HHS/United States
- 5U01ES017166-02/ES/NIEHS NIH HHS/United States
- F32 CA141799/CA/NCI NIH HHS/United States
- U01 ES017155-01/ES/NIEHS NIH HHS/United States
- U01 ES017166-01/ES/NIEHS NIH HHS/United States
- F32 CA141799-01/CA/NCI NIH HHS/United States
- 5U01ES017154-02/ES/NIEHS NIH HHS/United States
- 6U01ES017155-02/ES/NIEHS NIH HHS/United States
- U01 ES017154-01/ES/NIEHS NIH HHS/United States
- T32 CA108462-06/CA/NCI NIH HHS/United States
- T32 GM008568-04/GM/NIGMS NIH HHS/United States
- U01 ES017154/ES/NIEHS NIH HHS/United States
- T32 CA108462-04/CA/NCI NIH HHS/United States
- U01 DA025956/DA/NIDA NIH HHS/United States
- 5U01DA025956-02/DA/NIDA NIH HHS/United States
- T32 CA108462/CA/NCI NIH HHS/United States
- T32 GM008568/GM/NIGMS NIH HHS/United States
- R01 CA057621/CA/NCI NIH HHS/United States
- U01 ES017166/ES/NIEHS NIH HHS/United States
- R25 DA027995/DA/NIDA NIH HHS/United States
- T32 GM007067/GM/NIGMS NIH HHS/United States
- U01 ES017155/ES/NIEHS NIH HHS/United States
- U01 DA025956-01/DA/NIDA NIH HHS/United States
- F32CA141799/CA/NCI NIH HHS/United States
LinkOut - more resources
Full Text Sources
Other Literature Sources

