Integrating multiple aspects of mitochondrial dynamics in neurons: age-related differences and dynamic changes in a chronic rotenone model
- PMID: 20850532
- PMCID: PMC3021420
- DOI: 10.1016/j.nbd.2010.09.006
Integrating multiple aspects of mitochondrial dynamics in neurons: age-related differences and dynamic changes in a chronic rotenone model
Abstract
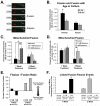
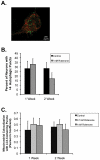
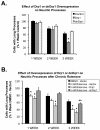
Changes in dynamic properties of mitochondria are increasingly implicated in neurodegenerative diseases, particularly Parkinson's disease (PD). Static changes in mitochondrial morphology, often under acutely toxic conditions, are commonly utilized as indicators of changes in mitochondrial fission and fusion. However, in neurons, mitochondrial fission and fusion occur in a dynamic system of axonal/dendritic transport, biogenesis and degradation, and thus, likely interact and change over time. We sought to explore this using a chronic neuronal model (nonlethal low-concentration rotenone over several weeks), examining distal neurites, which may give insight into the earliest changes occurring in PD. Using this model, in live primary neurons, we directly quantified mitochondrial fission, fusion, and transport over time and integrated multiple aspects of mitochondrial dynamics, including morphology and growth/mitophagy. We found that rates of mitochondrial fission and fusion change as neurons age. In addition, we found that chronic rotenone exposure initially increased the ratio of fusion to fission, but later, this was reversed. Surprisingly, despite changes in rates of fission and fusion, mitochondrial morphology was minimally affected, demonstrating that morphology can be an inaccurate indicator of fission/fusion changes. In addition, we found evidence of subcellular compartmentalization of compensatory changes, as mitochondrial density increased in distal neurites first, which may be important in PD, where pathology may begin distally. We propose that rotenone-induced early changes such as in mitochondrial fusion are compensatory, accompanied later by detrimental fission. As evidence, in a dopaminergic neuronal model, in which chronic rotenone caused loss of neurites before cell death (like PD pathology), inhibiting fission protected against the neurite loss. This suggests that aberrant mitochondrial dynamics may contribute to the earliest neuropathologic mechanisms in PD. These data also emphasize that mitochondrial fission and fusion do not occur in isolation, and highlight the importance of analysis and integration of multiple mitochondrial dynamic functions in neurons.
Copyright © 2010 Elsevier Inc. All rights reserved.
Figures


Similar articles
-
Evidence for Compartmentalized Axonal Mitochondrial Biogenesis: Mitochondrial DNA Replication Increases in Distal Axons As an Early Response to Parkinson's Disease-Relevant Stress.J Neurosci. 2018 Aug 22;38(34):7505-7515. doi: 10.1523/JNEUROSCI.0541-18.2018. Epub 2018 Jul 20. J Neurosci. 2018. PMID: 30030401 Free PMC article.
-
The Interaction of Mitochondrial Biogenesis and Fission/Fusion Mediated by PGC-1α Regulates Rotenone-Induced Dopaminergic Neurotoxicity.Mol Neurobiol. 2017 Jul;54(5):3783-3797. doi: 10.1007/s12035-016-9944-9. Epub 2016 Jun 7. Mol Neurobiol. 2017. PMID: 27271125
-
Mic60/mitofilin overexpression alters mitochondrial dynamics and attenuates vulnerability of dopaminergic cells to dopamine and rotenone.Neurobiol Dis. 2016 Jul;91:247-61. doi: 10.1016/j.nbd.2016.03.015. Epub 2016 Mar 19. Neurobiol Dis. 2016. PMID: 27001148 Free PMC article.
-
The interplay of neuronal mitochondrial dynamics and bioenergetics: implications for Parkinson's disease.Neurobiol Dis. 2013 Mar;51:43-55. doi: 10.1016/j.nbd.2012.05.015. Epub 2012 Jun 2. Neurobiol Dis. 2013. PMID: 22668779 Free PMC article. Review.
-
Mitochondrial dynamics in Parkinson's disease.Exp Neurol. 2009 Aug;218(2):247-56. doi: 10.1016/j.expneurol.2009.03.019. Epub 2009 Mar 28. Exp Neurol. 2009. PMID: 19332061 Free PMC article. Review.
Cited by
-
Potential Role of Mic60/Mitofilin in Parkinson's Disease.Front Neurosci. 2019 Jan 25;12:898. doi: 10.3389/fnins.2018.00898. eCollection 2018. Front Neurosci. 2019. PMID: 30740041 Free PMC article. Review.
-
Mitochondria in Developmental and Adult Neurogenesis.Neurotox Res. 2019 Aug;36(2):257-267. doi: 10.1007/s12640-018-9942-y. Epub 2018 Sep 13. Neurotox Res. 2019. PMID: 30215161 Review.
-
MitoTimer probe reveals the impact of autophagy, fusion, and motility on subcellular distribution of young and old mitochondrial protein and on relative mitochondrial protein age.Autophagy. 2013 Nov 1;9(11):1887-96. doi: 10.4161/auto.26503. Epub 2013 Sep 27. Autophagy. 2013. PMID: 24149000 Free PMC article.
-
Preconditioning as a potential strategy for the prevention of Parkinson's disease.Mol Neurobiol. 2015 Feb;51(1):313-30. doi: 10.1007/s12035-014-8689-6. Epub 2014 Apr 3. Mol Neurobiol. 2015. PMID: 24696268 Review.
-
Bioenergetics of neurons inhibit the translocation response of Parkin following rapid mitochondrial depolarization.Hum Mol Genet. 2011 Mar 1;20(5):927-40. doi: 10.1093/hmg/ddq531. Epub 2010 Dec 7. Hum Mol Genet. 2011. PMID: 21147754 Free PMC article.
References
Publication types
MeSH terms
Substances
Grants and funding
LinkOut - more resources
Full Text Sources
Medical
Research Materials

