Metabolomic analysis in severe childhood pneumonia in the Gambia, West Africa: findings from a pilot study
- PMID: 20844590
- PMCID: PMC2936566
- DOI: 10.1371/journal.pone.0012655
Metabolomic analysis in severe childhood pneumonia in the Gambia, West Africa: findings from a pilot study
Abstract
Background: Pneumonia remains the leading cause of death in young children globally and improved diagnostics are needed to better identify cases and reduce case fatality. Metabolomics, a rapidly evolving field aimed at characterizing metabolites in biofluids, has the potential to improve diagnostics in a range of diseases. The objective of this pilot study is to apply metabolomic analysis to childhood pneumonia to explore its potential to improve pneumonia diagnosis in a high-burden setting.
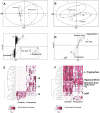
Methodology/principal findings: Eleven children with World Health Organization (WHO)-defined severe pneumonia of non-homogeneous aetiology were selected in The Gambia, West Africa, along with community controls. Metabolomic analysis of matched plasma and urine samples was undertaken using Ultra Performance Liquid Chromatography (UPLC) coupled to Time-of-Flight Mass Spectrometry (TOFMS). Biomarker extraction was done using SIMCA-P+ and Random Forests (RF). 'Unsupervised' (blinded) data were analyzed by Principal Component Analysis (PCA), while 'supervised' (unblinded) analysis was by Partial Least Squares-Discriminant Analysis (PLS-DA) and Orthogonal Projection to Latent Structures (OPLS). Potential markers were extracted from S-plots constructed following analysis with OPLS, and markers were chosen based on their contribution to the variation and correlation within the data set. The dataset was additionally analyzed with the machine-learning algorithm RF in order to address issues of model overfitting and markers were selected based on their variable importance ranking. Unsupervised PCA analysis revealed good separation of pneumonia and control groups, with even clearer separation of the groups with PLS-DA and OPLS analysis. Statistically significant differences (p<0.05) between groups were seen with the following metabolites: uric acid, hypoxanthine and glutamic acid were higher in plasma from cases, while L-tryptophan and adenosine-5'-diphosphate (ADP) were lower; uric acid and L-histidine were lower in urine from cases. The key limitation of this study is its small size.
Conclusions/significance: Metabolomic analysis clearly distinguished severe pneumonia patients from community controls. The metabolites identified are important for the host response to infection through antioxidant, inflammatory and antimicrobial pathways, and energy metabolism. Larger studies are needed to determine whether these findings are pneumonia-specific and to distinguish organism-specific responses. Metabolomics has considerable potential to improve diagnostics for childhood pneumonia.
Conflict of interest statement
Figures


Similar articles
-
[Urine metabolomics analysis based on ultra performance liquid chromatography-high resolution mass spectrometry combined with osmolality calibration sample concentration variability].Se Pu. 2021 Apr 8;39(4):391-398. doi: 10.3724/SP.J.1123.2020.06018. Se Pu. 2021. PMID: 34227759 Free PMC article. Chinese.
-
Translational Metabolomics of Head Injury: Exploring Dysfunctional Cerebral Metabolism with Ex Vivo NMR Spectroscopy-Based Metabolite Quantification.In: Kobeissy FH, editor. Brain Neurotrauma: Molecular, Neuropsychological, and Rehabilitation Aspects. Boca Raton (FL): CRC Press/Taylor & Francis; 2015. Chapter 25. In: Kobeissy FH, editor. Brain Neurotrauma: Molecular, Neuropsychological, and Rehabilitation Aspects. Boca Raton (FL): CRC Press/Taylor & Francis; 2015. Chapter 25. PMID: 26269925 Free Books & Documents. Review.
-
LC/MS-based discrimination between plasma and urine metabolomic changes following exposure to ultraviolet radiation by using data modelling.Metabolomics. 2023 Feb 13;19(2):13. doi: 10.1007/s11306-023-01977-0. Metabolomics. 2023. PMID: 36781606 Free PMC article.
-
Urinary metabonomic study of Panax ginseng in deficiency of vital energy rat using ultra performance liquid chromatography coupled with quadrupole time-of-flight mass spectrometry.J Ethnopharmacol. 2016 May 26;184:10-7. doi: 10.1016/j.jep.2016.02.031. Epub 2016 Feb 24. J Ethnopharmacol. 2016. PMID: 26921673
-
Epidemiology of acute lower respiratory tract infections, especially those due to Haemophilus influenzae type b, in The Gambia, west Africa.J Infect Dis. 1992 Jun;165 Suppl 1:S26-8. doi: 10.1093/infdis/165-supplement_1-s26. J Infect Dis. 1992. PMID: 1588169 Review.
Cited by
-
Identification of systemic immune response markers through metabolomic profiling of plasma from calves given an intra-nasally delivered respiratory vaccine.Vet Res. 2015 Feb 14;46:7. doi: 10.1186/s13567-014-0138-z. Vet Res. 2015. PMID: 25828073 Free PMC article.
-
Untargeted Blood Lipidomics Analysis in Critically Ill Pediatric Patients with Ventilator-Associated Pneumonia: A Pilot Study.Metabolites. 2024 Aug 23;14(9):466. doi: 10.3390/metabo14090466. Metabolites. 2024. PMID: 39330473 Free PMC article.
-
Analysis of serum metabolic profile by ultra-performance liquid chromatography-mass spectrometry for biomarkers discovery: application in a pilot study to discriminate patients with tuberculosis.Chin Med J (Engl). 2015 Jan 20;128(2):159-68. doi: 10.4103/0366-6999.149188. Chin Med J (Engl). 2015. PMID: 25591556 Free PMC article.
-
New markers in pneumonia.Clin Chim Acta. 2013 Apr 18;419:19-25. doi: 10.1016/j.cca.2013.01.011. Epub 2013 Feb 4. Clin Chim Acta. 2013. PMID: 23384502 Free PMC article. Review.
-
Distinct serum metabolomics profiles associated with malignant progression in the KrasG12D mouse model of pancreatic ductal adenocarcinoma.BMC Genomics. 2015;16 Suppl 1(Suppl 1):S1. doi: 10.1186/1471-2164-16-S1-S1. Epub 2015 Jan 15. BMC Genomics. 2015. PMID: 25923219 Free PMC article.
References
-
- Black RE, Morris SS, Bryce J. Where and why are 10 million children dying every year? Lancet. 2003;361:2226–2234. - PubMed
-
- Garenne M, Ronsmans C, Campbell H. The magnitude of mortality from acute respiratory infections in children under 5 years in developing countries. World Health Stat Q. 1992;45:180–191. - PubMed
-
- Mathers CSC, Fat D. Global Burden of Disease 2000: version 2, methods and results
-
- Mulholland K. Global burden of acute respiratory infections in children: implications for interventions. Pediatr Pulmonol. 2003;36:469–474. - PubMed
-
- Mulholland K. Childhood pneumonia mortality—a permanent global emergency. Lancet. 2007;370:285–289. - PubMed
Publication types
MeSH terms
Substances
Grants and funding
LinkOut - more resources
Full Text Sources
Other Literature Sources
Medical

