

Molecular Data are Transforming Hypotheses on the Origin and Diversification of Eukaryotes
- PMID: 20842214
- PMCID: PMC2938078
- DOI: 10.1525/bio.2009.59.6.5
Molecular Data are Transforming Hypotheses on the Origin and Diversification of Eukaryotes
Abstract
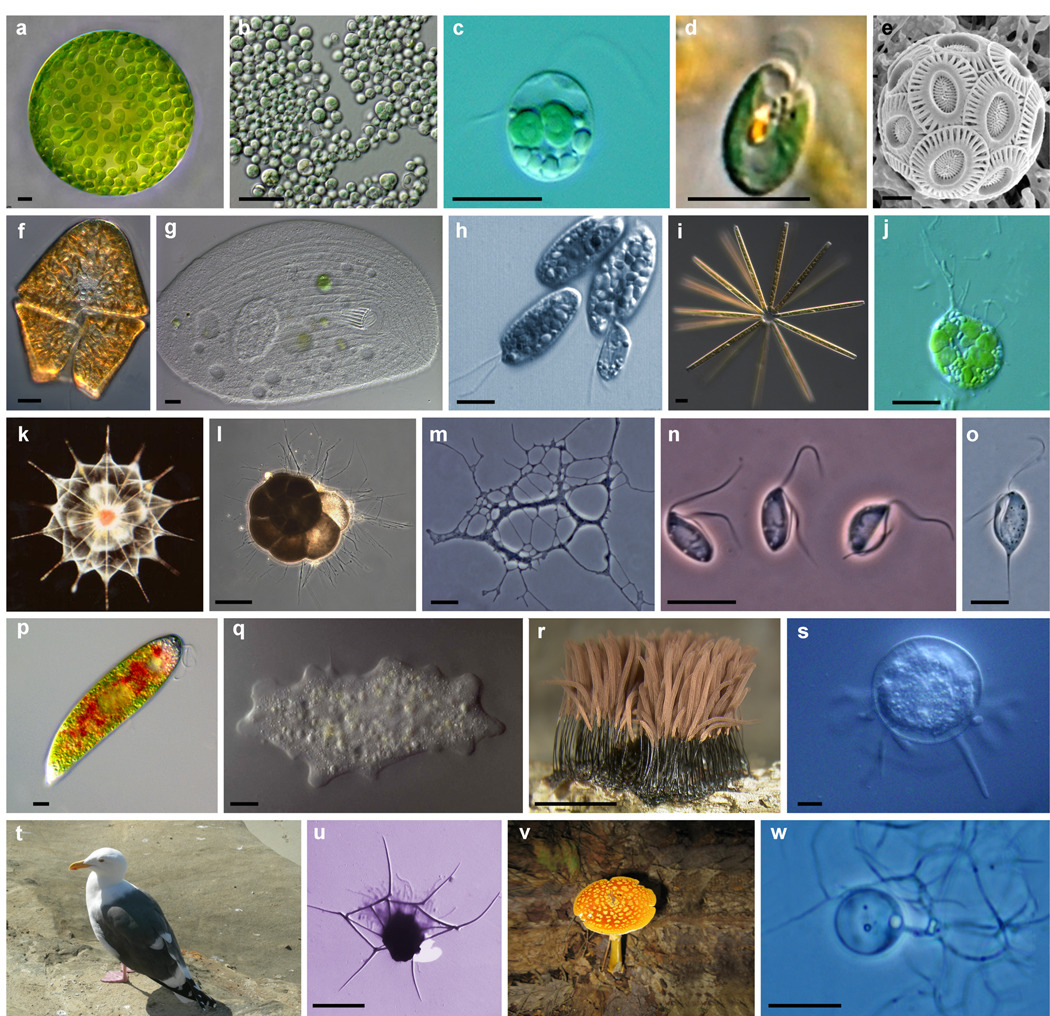
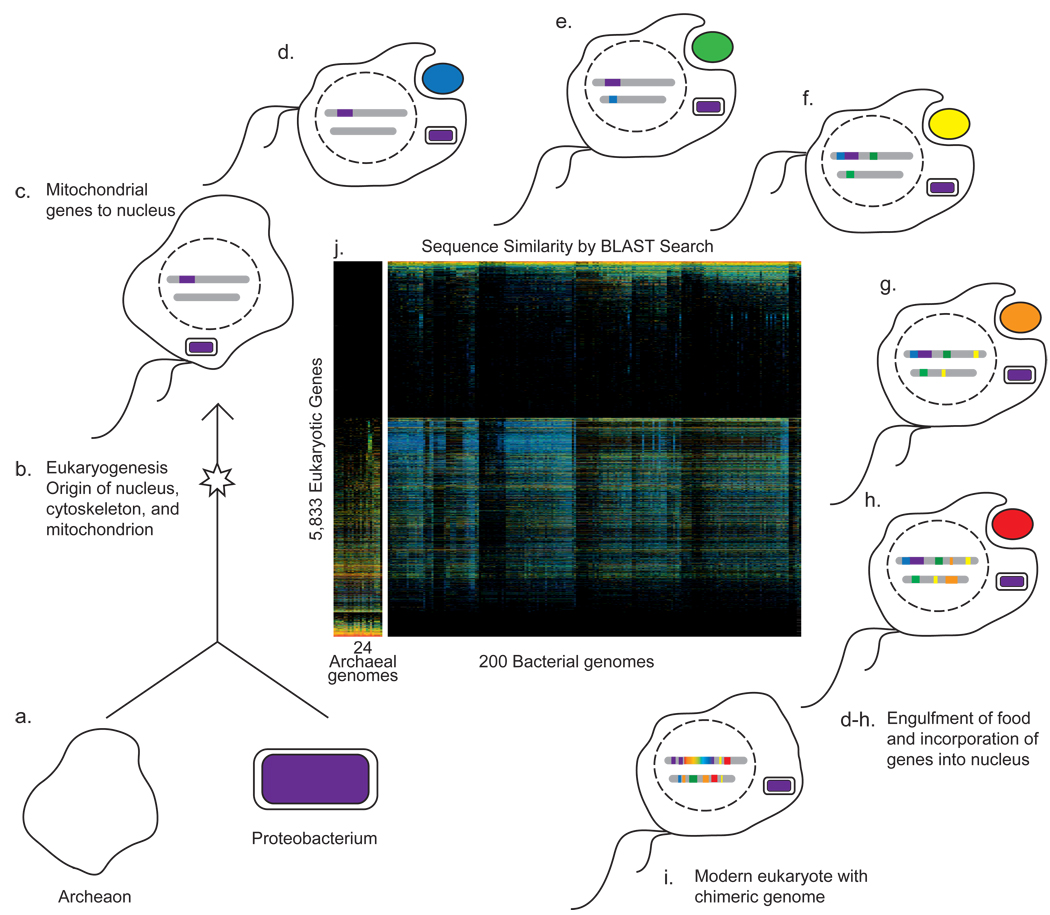
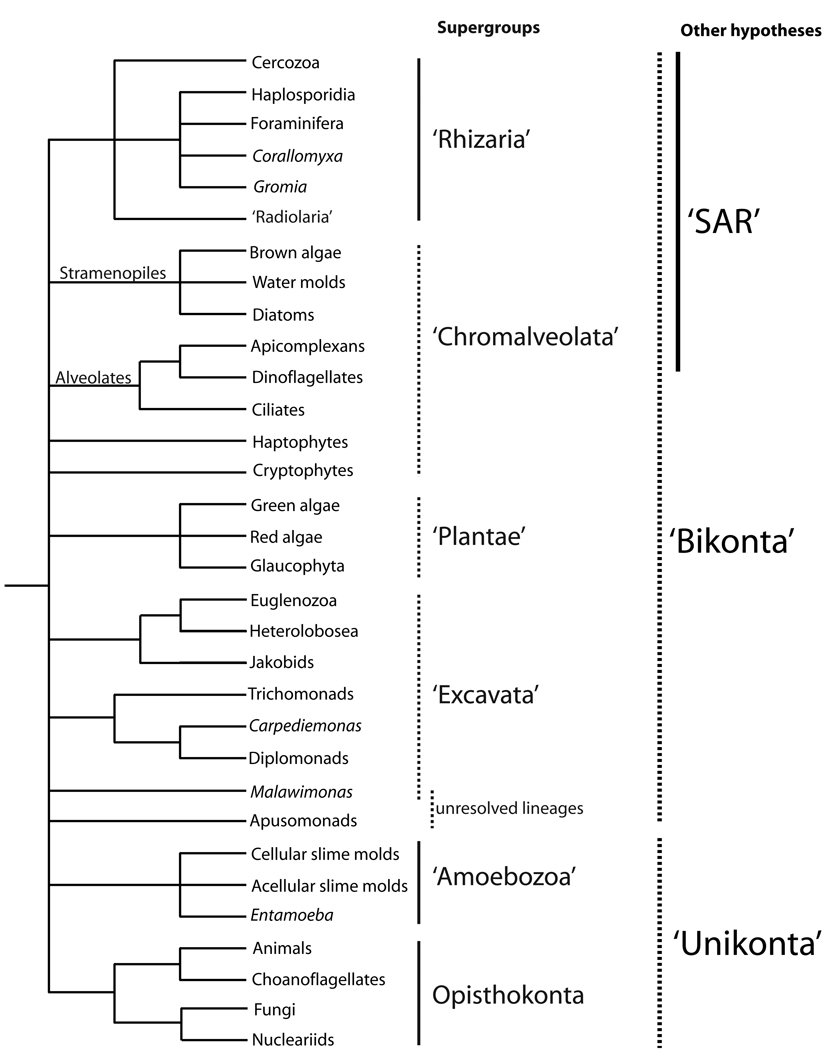
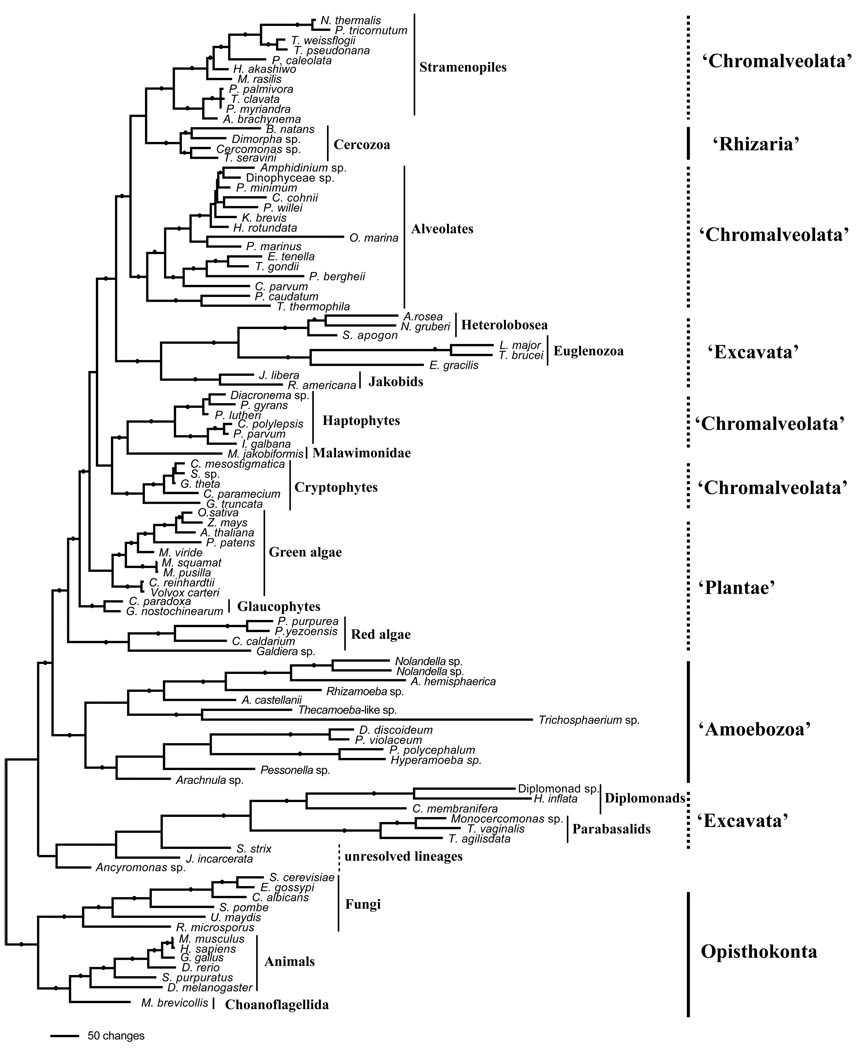
The explosion of molecular data has transformed hypotheses on both the origin of eukaryotes and the structure of the eukaryotic tree of life. Early ideas about the evolution of eukaryotes arose through analyses of morphology by light microscopy and later electron microscopy. Though such studies have proven powerful at resolving more recent events, theories on origins and diversification of eukaryotic life have been substantially revised in light of analyses of molecular data including gene and, increasingly, whole genome sequences. By combining these approaches, progress has been made in elucidating both the origin and diversification of eukaryotes. Yet many aspects of the evolution of eukaryotic life remain to be illuminated.
Figures
Similar articles
-
Origin and diversification of eukaryotes.Annu Rev Microbiol. 2012;66:411-27. doi: 10.1146/annurev-micro-090110-102808. Epub 2012 Jul 9. Annu Rev Microbiol. 2012. PMID: 22803798 Review.
-
Lateral gene transfers and the evolution of eukaryotes: theories and data.Int J Syst Evol Microbiol. 2002 Sep;52(Pt 5):1893-1900. doi: 10.1099/00207713-52-5-1893. Int J Syst Evol Microbiol. 2002. PMID: 12361302 Review.
-
The Tangled Web: Gene Genealogies and the Origin of Eukaryotes.Am Nat. 1999 Oct;154(S4):S137-S145. doi: 10.1086/303289. Am Nat. 1999. PMID: 10527923
-
[Progress in elucidating the origin of eukaryotes].Yi Chuan. 2020 Oct 20;42(10):929-948. doi: 10.16288/j.yczz.20-107. Yi Chuan. 2020. PMID: 33229320 Review. Chinese.
-
The phagotrophic origin of eukaryotes and phylogenetic classification of Protozoa.Int J Syst Evol Microbiol. 2002 Mar;52(Pt 2):297-354. doi: 10.1099/00207713-52-2-297. Int J Syst Evol Microbiol. 2002. PMID: 11931142 Review.
Cited by
-
Broadly sampled multigene analyses yield a well-resolved eukaryotic tree of life.Syst Biol. 2010 Oct;59(5):518-33. doi: 10.1093/sysbio/syq037. Epub 2010 Jul 23. Syst Biol. 2010. PMID: 20656852 Free PMC article.
-
Perspectives in PDK1 evolution: insights from photosynthetic and non-photosynthetic organisms.Plant Signal Behav. 2012 Jun;7(6):642-9. doi: 10.4161/psb.20038. Epub 2012 May 14. Plant Signal Behav. 2012. PMID: 22580698 Free PMC article. Review.
-
Cytoskeletal architecture and its evolutionary significance in amoeboid eukaryotes and their mode of locomotion.R Soc Open Sci. 2016 Sep 28;3(9):160283. doi: 10.1098/rsos.160283. eCollection 2016 Sep. R Soc Open Sci. 2016. PMID: 27703691 Free PMC article.
-
A practical implementation of large transcriptomic data analysis to resolve cryptic species diversity problems in microbial eukaryotes.BMC Evol Biol. 2018 Nov 16;18(1):170. doi: 10.1186/s12862-018-1283-1. BMC Evol Biol. 2018. PMID: 30445905 Free PMC article.
-
Rapid shifts in the structure and composition of a protistan assemblage during bottle incubations affect estimates of total protistan species richness.Microb Ecol. 2011 Aug;62(2):383-98. doi: 10.1007/s00248-011-9816-9. Epub 2011 Mar 4. Microb Ecol. 2011. PMID: 21373815
References
-
- Adl SM, et al. The new higher level classification of eukaryotes with emphasis on the taxonomy of protists. Journal of Eukaryotic Microbiology. 2005;52:399–451. - PubMed
-
- Archibald JM. Endosymbiosis: double-take on plastid origins. Current Biology. 2006;16:R690–R692. - PubMed
-
- Baldauf SL, Roger AJ, Wenk-Siefert I, Doolittle WF. A kingdom-level phylogeny of eukaryotes based on combined protein data. Science. 2000;290:972–977. - PubMed
-
- Bhattacharya D, Yoon HS, Hackett JD. Photosynthetic eukaryotes unite: endosymbiosis connects the dots. Bioessays. 2004;26:50–60. - PubMed
-
- Bodyl A. Do plastid-related characters support the chromalveolate hypothesis? Journal of Phycology. 2005;41:712–719.
Grants and funding
LinkOut - more resources
Full Text Sources
