. 2010 Sep 21;107(38):16595-600.
doi: 10.1073/pnas.1010494107. Epub 2010 Sep 7.

Mutations in mouse Aspm (abnormal spindle-like microcephaly associated) cause not only microcephaly but also major defects in the germline

Affiliations

Mutations in mouse Aspm (abnormal spindle-like microcephaly associated) cause not only microcephaly but also major defects in the germline

Jeremy N Pulvers et al. Proc Natl Acad Sci U S A. .

Abstract

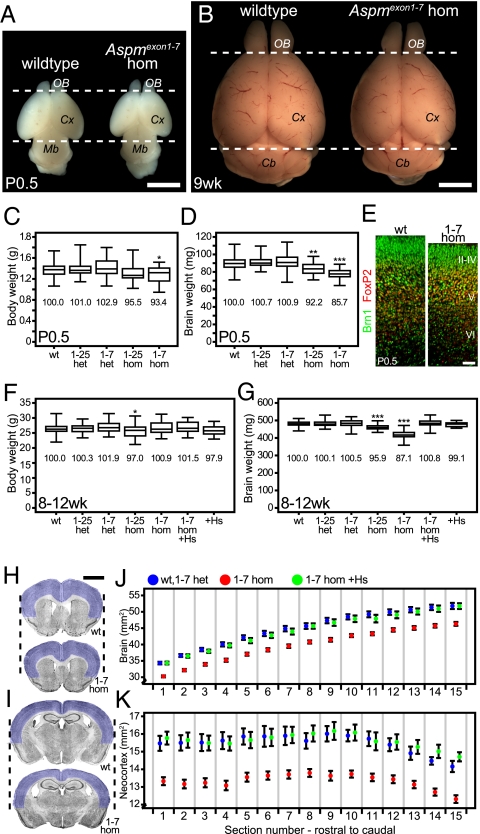
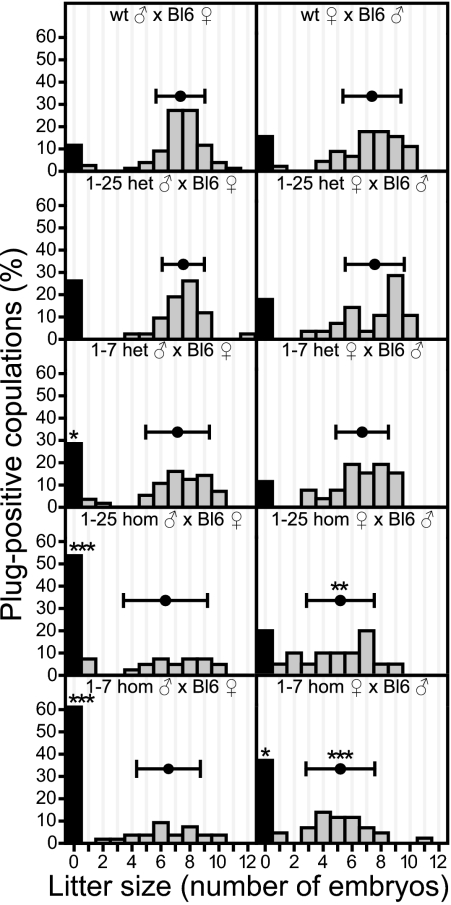
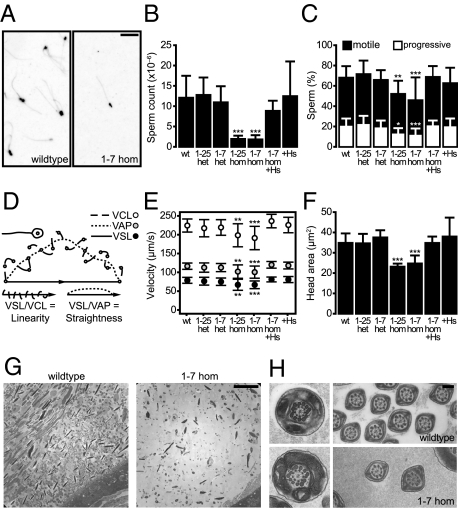
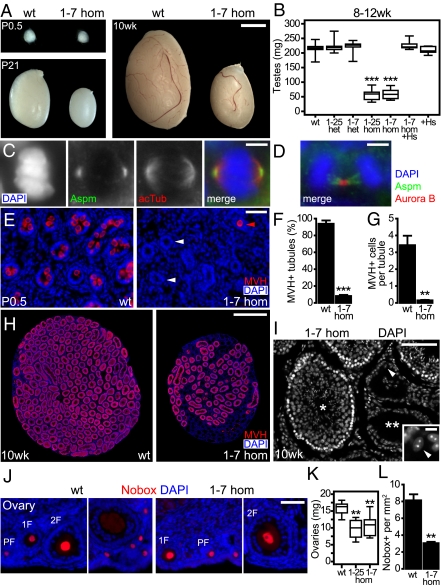
Mutations in ASPM (abnormal spindle-like microcephaly associated) cause primary microcephaly in humans, a disorder characterized by a major reduction in brain size in the apparent absence of nonneurological anomalies. The function of the Aspm protein in neural progenitor cell expansion, as well as its localization to the mitotic spindle and midbody, suggest that it regulates brain development by a cell division-related mechanism. Furthermore, evidence that positive selection affected ASPM during primate evolution has led to suggestions that such a function changed during primate evolution. Here, we report that in Aspm mutant mice, truncated Aspm proteins similar to those causing microcephaly in humans fail to localize to the midbody during M-phase and cause mild microcephaly. A human ASPM transgene rescues this phenotype but, interestingly, does not cause a gain of function. Strikingly, truncated Aspm proteins also cause a massive loss of germ cells, resulting in a severe reduction in testis and ovary size accompanied by reduced fertility. These germline effects, too, are fully rescued by the human ASPM transgene, indicating that ASPM is functionally similar in mice and humans. Our findings broaden the spectrum of phenotypic effects of ASPM mutations and raise the possibility that positive selection of ASPM during primate evolution reflects its function in the germline.


Conflict of interest statement

The authors declare no conflict of interest.

Figures

Fig. 1.
Fig. 1.
Brain size analysis of Aspm mutant and human ASPM transgenic mice. (A and B) Brains from newborn (P0.5) and adult (9 wk) WT and Aspm1-7-hom. Dashed lines delimit the rostrocaudal extent of the WT cerebral cortex (Cx). OB, olfactory bulb; Mb, midbrain; Cb, cerebellum. (Scale bar, 3 mm.) (C and D) Boxplot of whole body (C) and brain (D) weight of P0.5 WT and Aspm1-25 (1-25) and Aspm1-7 (1-7) heterozygous (het) and homozygous (hom) mice. Data from (left to right) 51, 34, 58, 18, and 22 mice. Mean weights compared with WT are indicated as percentages. (E) Double immunofluorescence for Brn1 (green) and FoxP2 (red) of vibratome sections (6-μm optical sections) of P0.5 neocortex. Cortical layers are indicated by II-VI. (Scale bar, 50 μm.) (F and G) Boxplot of whole-body (F) and brain (G) weight of adult (8–12 wk) WT, 1-25, and 1-7 het and hom, Aspm1-7-hom with human ASPM BAC (1-7 hom +Hs), and WT mice with human ASPM BAC (+Hs). Data from (left to right) 65, 37, 27, 35, 59, 42, and 24 mice. Mean weights compared with WT are indicated as percentages. (H and I) Nissl staining of coronal 50-μm vibratome sections of adult brains from WT and 1-7 hom. Dashed lines delimit the lateral extent of the WT sections. Neocortex is highlighted in blue. Note the smaller size of the 1-7 hom brain. (Scale bar, 2 mm.) (J and K) Quantification of whole-brain (J) and neocortex (K) area across 15 sections along the rostrocaudal axis of control (WT and 1-7 het, n = 9, blue), 1-7 hom (n = 20, red), and 1-7 hom +Hs (n = 12, green). Sections in H and I are representative of sections 1 and 15 in the area quantifications, respectively. Data points indicate mean area (square millimeters); error bars indicate SEM. All data points of the 1-7 hom are significantly reduced (P < 0.001) compared with control. In boxplots (C, D, F, and G), the line within the box indicates the median value, the box spans the interquartile range, and whiskers extend to data extremes. *P < 0.05; **P < 0.01; ***P < 0.001.
Fig. 2.
Fig. 2.
Mutations in mouse Aspm reduce fertility in males and females. Frequency of occurrence of various litter sizes, expressed as percentage of all vaginal plug-positive copulations, for WT and 1-25 and 1-7 het and hom males (Left) and females (Right) paired with C57BL/6 females and males, respectively. Black columns indicate the percentage of females with no embryos (litter size = 0), gray columns the percentage of litters with embryos. Mean number of embryos in pregnant females is illustrated above the gray columns; horizontal error bars indicate SD. Data from (left, top to bottom) 74, 40, 55, 35, and 54 matings and (right, top to bottom) 45, 28, 26, 20, and 39 matings. *P < 0.05; **P < 0.01; ***P < 0.001.
Fig. 3.
Fig. 3.
Sperm analysis in Aspm mutant mice. (A) Dark-field image (inverted) of live epididymal sperm from WT and 1-7 hom mice. (Scale bar, 50 μm.) (B, C, E, and F) Epididymal sperm parameters of adult (8–12 wk) WT, 1-25 and 1-7 het and hom, 1-7 hom +Hs, and +Hs mice, obtained using the IVOS sperm analyzer. Data are the mean of (left to right) 21, 10, 11, 8, 13, 7, and 8 mice; error bars indicate SD; *P < 0.05; **P < 0.01; ***P < 0.001. (B) Sperm count. (C) Percentage of sperm categorized as motile (black columns), of which a subset is categorized as progressive (white column segments). (D) Schematic illustration of sperm velocity parameters defined by the sperm analyzer: the track speed of motile sperm defined as the VCL (dashed lines), VAP (dotted lines), and VSL (solid line with arrowhead) calculated from the distance between the start and the end of the track. Furthermore, sperm movement can be characterized by the ratios VSL/VCL (linearity) and by VSL/VAP (straightness). (E) Sperm velocity parameters as defined in D: VCL (white circles), VAP (gray circles), and VSL (black circles). (F) Sperm head area. (G and H) Transmission electron microscopy of adult epididymis from adult WT (G, Left; H, Upper) and 1-7 hom (G, Right; H, Lower) mice. Note the reduction in cell density within the epididymis (G) and the normal axoneme ultrastructure (H) of the 1-7 hom compared with WT. (Scale bar, 10 μm in G; 200 nm in H.)
Fig. 4.
Fig. 4.
Aspm mutations cause major defects in the male and female germlines. (A) Testes from newborn (P0.5), juvenile (P21), and adult (10 wk) WT and 1-7 hom mice. (Scale bar, 2 mm.) (B) Boxplot of testis weight (sum of left and right testis) of adult (8–12 wk) WT, 1-25 and 1-7 het and hom, 1-7 hom +Hs, and +Hs mice. Data from (left to right) 34, 13, 13, 12, 16, 7, and 10 mice. (C and D) Double immunofluorescence for Aspm (green) with acetylated α-tubulin (acTub, red) in C, and with Aurora B (red) in D, combined with DAPI staining (blue), of 10-μm cryosections (epifluorescence) of an adult testis from a WT mouse. A spermatogenic cell in metaphase is shown in C, and in telophase in D. (Scale bar, 5 μm.) (E) Immunofluorescence for MVH (red) with DAPI staining (blue) of 10-μm cryosections (epifluorescence) of testes from P0.5 WT (Left) and 1-7 hom (Right) mice. In WT, numerous MVH+ cells are found in the seminiferous tubules, whereas in 1-7 hom, most tubules lack germ cells (white arrowheads), and only a few tubules contain MVH+ gonocytes (red arrowhead). (Scale bar, 50 μm.) (F and G) Quantification of seminiferous tubules containing MVH+ cells, expressed as a percentage of the total number of tubules contained in testis sections (F), and the average number of MVH+ cells per seminiferous tubule in testis sections (G), from P0.5 WT and 1-7 hom mice. Data are the mean of testes from three mice (sum of five sections per testis). (H) Immunofluorescence for MVH (red) combined with DAPI staining (blue) of 10-μm cryosections (epifluorescence) of testes, cut orthogonally to the longitudinal axis, from 10-wk-old WT (Left) and 1-7 hom (Right) mice. In WT, essentially every seminiferous tubule contains MVH+ spermatogenic cells, whereas in 1-7 hom, only approximately half of the tubules contain MVH+ cells. (Scale bar, 1 mm.) (I) DAPI staining of a 10-μm cryosection (epifluoresence) of a testis from a 10-wk-old 1-7 hom mouse, showing a tubule containing spermatogenic cells (single asterisk), and empty tubules (double asterisk) containing only few Sertoli cells, identified by the characteristic centromeric heterochromatin condensed in two chromocenters revealed by DAPI staining (Inset). (Scale bar, 100 μm, 10 μm in Inset.) (J) Immunofluorescence for Nobox (red) combined with DAPI staining (blue) of 10-μm cryosections (epifluorescence) of ovaries from adult WT (Left) and 1-7 hom (Right) mice. All follicular stages—primordial (PF), primary (1F), secondary (2F), and antral follicles—were observed in WT and 1-7 hom ovaries. (Scale bar, 50 μm.) (K) Boxplot of ovary weight (sum of left and right ovary) of adult (10–12 wk) WT and 1-25 and 1-7 hom mice. Data from (left to right) 7, 4, and 9 mice. (L) Quantification of Nobox+ cells per total ovary section area from adult (10–12 wk) WT and 1-7 hom mice. Data are the mean of ovaries from three mice (sum of five sections per ovary). In boxplots (B and K), the line within the box indicates the median value, the box spans the interquartile range, and whiskers extend to data extremes. **P < 0.01; ***P < 0.001.

Similar articles

Cited by

References

    1. Rakic P. Evolution of the neocortex: A perspective from developmental biology. Nat Rev Neurosci. 2009;10:724–735. - PMC - PubMed
    1. Kriegstein A, Noctor S, Martínez-Cerdeño V. Patterns of neural stem and progenitor cell division may underlie evolutionary cortical expansion. Nat Rev Neurosci. 2006;7:883–890. - PubMed
    1. Fish JL, Dehay C, Kennedy H, Huttner WB. Making bigger brains—the evolution of neural-progenitor-cell division. J Cell Sci. 2008;121:2783–2793. - PubMed
    1. Woods CG. Human microcephaly. Curr Opin Neurobiol. 2004;14:112–117. - PubMed
    1. Bond J, et al. ASPM is a major determinant of cerebral cortical size. Nat Genet. 2002;32:316–320. - PubMed

Publication types

MeSH terms