

The role of RPE cell-associated VEGF₁₈₉ in choroidal endothelial cell transmigration across the RPE
- PMID: 20811045
- PMCID: PMC3053298
- DOI: 10.1167/iovs.10-5595
The role of RPE cell-associated VEGF₁₈₉ in choroidal endothelial cell transmigration across the RPE
Abstract
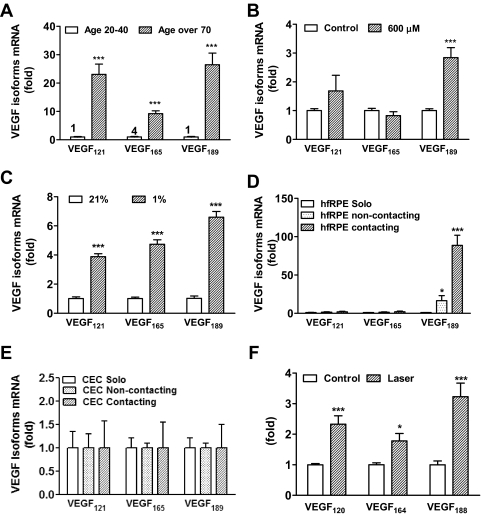
Purpose: To determine the role of vascular endothelial growth factor 189 (VEGF₁₈₉) in choroidal endothelial cell (CEC) migration across the retinal pigment epithelium (RPE) and to explore the molecular mechanisms involved.
Methods: Using real-time PCR, the expression of VEGF splice variants VEGF₁₂₁, VEGF₁₆₅, and VEGF₁₈₉ was determined in human RPE from donor eyes, cultured human RPE in contact with CECs exposed to hydrogen peroxide (H₂O₂) or hypoxia, and RPE/choroid specimens from mice treated with laser to induce choroidal neovascularization (CNV). Activation of VEGF receptors (VEGFRs), phosphoinositol 3-kinase (PI-3K) or Rac1 was measured in CECs cocultured in contact with RPE exposed to peroxide or silenced for VEGF₁₈₉ expression. Migration of CECs across the RPE was determined using fluorescence microscopy.
Results: VEGF₁₈₉ expression was increased in human RPE from aged compared with young donor eyes and from mouse RPE/choroids after laser to induce CNV. VEGF₁₈₉ was also upregulated in human RPE challenged with peroxide, hypoxia, or cultured in contact with CECs. CEC migration across RPE was greater after RPE exposure to peroxide to induce VEGF₁₈₉; VEGFR2 and Rac1 activities were also increased in these CECs. When CECs were cocultured with RPE silenced for VEGF₁₈₉, VEGFR2 and Rac1 activities in CECs were significantly reduced, as was CEC migration across the RPE. Inhibition of Rac1 activity significantly inhibited CEC transmigration without affecting PI-3K activity.
Conclusions: RPE-derived cell-associated VEGF₁₈₉ facilitates CEC transmigration by Rac1 activation independently of PI-3K signaling and may have importance in the development of neovascular AMD.
Figures


Similar articles
-
Upregulation of CCR3 by age-related stresses promotes choroidal endothelial cell migration via VEGF-dependent and -independent signaling.Invest Ophthalmol Vis Sci. 2011 Oct 21;52(11):8271-7. doi: 10.1167/iovs.11-8230. Invest Ophthalmol Vis Sci. 2011. PMID: 21917937 Free PMC article.
-
Thy-1 Regulates VEGF-Mediated Choroidal Endothelial Cell Activation and Migration: Implications in Neovascular Age-Related Macular Degeneration.Invest Ophthalmol Vis Sci. 2016 Oct 1;57(13):5525-5534. doi: 10.1167/iovs.16-19691. Invest Ophthalmol Vis Sci. 2016. PMID: 27768790 Free PMC article.
-
Heterotypic RPE-choroidal endothelial cell contact increases choroidal endothelial cell transmigration via PI 3-kinase and Rac1.Exp Eye Res. 2007 Apr;84(4):737-44. doi: 10.1016/j.exer.2006.12.012. Epub 2006 Dec 23. Exp Eye Res. 2007. PMID: 17292356 Free PMC article.
-
Regulation of signaling events involved in the pathophysiology of neovascular AMD.Mol Vis. 2016 Feb 27;22:189-202. eCollection 2016. Mol Vis. 2016. PMID: 27013848 Free PMC article. Review.
-
Regulation of Rac1 Activation in Choroidal Endothelial Cells: Insights into Mechanisms in Age-Related Macular Degeneration.Cells. 2021 Sep 14;10(9):2414. doi: 10.3390/cells10092414. Cells. 2021. PMID: 34572063 Free PMC article. Review.
Cited by
-
Attenuation of choroidal neovascularization by β(2)-adrenoreceptor antagonism.JAMA Ophthalmol. 2013 Mar;131(3):376-82. doi: 10.1001/jamaophthalmol.2013.1476. JAMA Ophthalmol. 2013. PMID: 23303344 Free PMC article.
-
The small GTPase Rap1 is a novel regulator of RPE cell barrier function.Invest Ophthalmol Vis Sci. 2011 Sep 27;52(10):7455-63. doi: 10.1167/iovs.11-7295. Invest Ophthalmol Vis Sci. 2011. PMID: 21873678 Free PMC article.
-
Identification of a synergistic interaction between endothelial cells and retinal pigment epithelium.J Cell Mol Med. 2017 Oct;21(10):2542-2552. doi: 10.1111/jcmm.13175. Epub 2017 Apr 12. J Cell Mol Med. 2017. PMID: 28402065 Free PMC article.
-
Zeaxanthin inhibits hypoxia-induced VEGF secretion by RPE cells through decreased protein levels of hypoxia-inducible factors-1α.Biomed Res Int. 2015;2015:687386. doi: 10.1155/2015/687386. Epub 2015 Jan 20. Biomed Res Int. 2015. PMID: 25688362 Free PMC article.
-
Effect of Decorin and Bevacizumab on oxygen-induced retinopathy in rat models: A comparative study.Indian J Ophthalmol. 2021 Feb;69(2):369-373. doi: 10.4103/ijo.IJO_1739_20. Indian J Ophthalmol. 2021. PMID: 33463595 Free PMC article.
References
-
- Hartnett ME, Elsner AE. Characteristics of exudative age-related macular degeneration determined in vivo with confocal and indirect infrared imaging. Ophthalmology. 1996;103:58–71 - PubMed
-
- Stevens TS, Bressler NM, Maguire MG, et al. Occult choroidal neovascularization in age-related macular degeneration: a natural history study. Arch Ophthalmol. 1997;115:345–350 - PubMed
-
- Marmor MF. From sea lemons to c-waves. Cell Mol Neurobiol. 1983;3:285–295 - PubMed
-
- Slomiany MG, Rosenzweig SA. IGF-1-induced VEGF and IGFBP-3 secretion correlates with increased HIF-1alpha expression and activity in retinal pigment epithelial cell line D407. Invest Ophthalmol Vis Sci. 2004;45:2838–2847 - PubMed
Publication types
MeSH terms
Substances
Grants and funding
LinkOut - more resources
Full Text Sources
Other Literature Sources
Molecular Biology Databases
Research Materials
Miscellaneous
