Comparative Study
. 2010 Sep 1;30(35):11565-75.
doi: 10.1523/JNEUROSCI.1746-10.2010.

Long-term potentiation-dependent spine enlargement requires synaptic Ca2+-permeable AMPA receptors recruited by CaM-kinase I

Affiliations
Comparative Study

Long-term potentiation-dependent spine enlargement requires synaptic Ca2+-permeable AMPA receptors recruited by CaM-kinase I

Dale A Fortin et al. J Neurosci. .

Abstract

It is well established that long-term potentiation (LTP), a paradigm for learning and memory, results in a stable enlargement of potentiated spines associated with recruitment of additional GluA1-containing AMPA receptors (AMPARs). Although regulation of the actin cytoskeleton is involved, the detailed signaling mechanisms responsible for this spine expansion are unclear. Here, we used cultured mature hippocampal neurons stimulated with a glycine-induced, synapse-specific form of chemical LTP (GI-LTP). We report that the stable structural plasticity (i.e., spine head enlargement and spine length shortening) that accompanies GI-LTP was blocked by inhibitors of NMDA receptors (NMDARs; APV) or CaM-kinase kinase (STO-609), the upstream activator of CaM-kinase I (CaMKI), as well as by transfection with dominant-negative (dn) CaMKI but not dnCaMKIV. Recruitment of GluA1 to the spine surface occurred after GI-LTP and was mimicked by transfection with constitutively active CaMKI. Spine enlargement induced by transfection of GluA1 was associated with synaptic recruitment of Ca(2+)-permeable AMPARs (CP-AMPARs) as assessed by an increase in the rectification index of miniature EPSCs (mEPSCs) and their sensitivity to IEM-1460, a selective antagonist of CP-AMPARs. Furthermore, the increase in spine size and mEPSC amplitude resulting from GI-LTP itself was blocked by IEM-1460, demonstrating involvement of CP-AMPARs. Downstream signaling effectors of CP-AMPARs, identified by suppression of their activation by IEM-1460, included the Rac/PAK/LIM-kinase pathway that regulates spine actin dynamics. Together, our results suggest that synaptic recruitment of CP-AMPARs via CaMKI may provide a mechanistic link between NMDAR activation in LTP and regulation of a signaling pathway that drives spine enlargement via actin polymerization.


Figures

Figure 1.
Figure 1.
GI-LTP structural plasticity requires NMDARs and CaMKK. A, Representative fluorescence images of secondary hippocampal dendritic spines visualized using mRFP-β-actin for conditions indicated. For some experiments, neurons were pretreated with either APV (50 μm, 30 min) or STO-609 (10 μm, 4 h) or transfected with plasmid expressing a STO-insensitive mutant of CaMKK (STOins, 24 h) before GI-LTP treatment (10 min GI-LTP) (see Materials and Methods). Scale bar, 5 μm. B, Quantitative analysis of spine head width (left) and spine length (right) for conditions indicated. C, Cumulative distribution plots for spine head width (left) and length (right) of the population of spines analyzed (n = 75–100 spines/neuron; 5–6 neurons per coverslip). Error bars indicate SEM (n = 8–10 coverslips per condition from 2–3 independent cultures). *p < 0.05 by Student's t test.
Figure 2.
Figure 2.
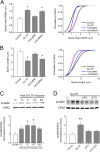
CaMKK signals through CaMKI but not CaMKIV to induce GI-LTP structural plasticity. A, B, Quantitative analysis (left) and cumulative distribution plots (right) for spine head width (A) and spine length (B) for each condition shown. Neurons were transfected with plasmids expressing dnCaMKI or dnCaMKIV 48 h before GI-LTP induction. *p < 0.05 by Student's t test. C, Top, Representative Western blots for pCaMKI and total ERK2 (loading control) for the indicated time points after the 10 min GI-LTP treatment. Bottom, Quantification of pCaMKI intensities before and after GI-LTP (n = 3 independent experiments). Error bars indicate SEM (n = 3 from 3 independent experiments). *p < 0.05 by one-way ANOVA. D, Top, Representative Western blots of pCaMKI and total ERK2 5 min after GI-LTP induction with or without APV or STO-609 (STO) treatments as in Figure 1. Bottom, Quantification of pCaMKI intensities for each condition shown (n = 3–5 from 3 independent experiments). Group data shown as mean ± SEM. **p < 0.01 by Student's t test.
Figure 3.
Figure 3.
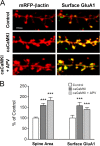
Constitutively active CaMKI mimics structural plasticity induced by GI-LTP and increases surface GluA1. A, Immunofluorescence images of hippocampal dendritic spines highlighted with mRFP-β-actin (left) or superimposed with surface GluA1 pseudo-colored in green (right) for controls (top) or neurons transfected with caCaMKI (24 h before fixation) without (middle) or with (bottom) treatment with APV added immediately after transfection and kept present until fixation. Surface GluA1 staining was performed using an N-terminal antibody under nonpermeabilizing conditions. Scale bar, 2.5 μm. B, Group data for spine head width and surface GluA1 for conditions illustrated in A (n = 50–75 spines per neuron; 5–8 neurons per coverslip). Error bars indicate SEM (n = 8 coverslips per condition from 3 independent cultures). ***p < 0.001 by Student's t test.
Figure 4.
Figure 4.
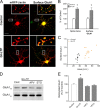
GI-LTP-induced surface trafficking of GluA1 requires CaMKK. A, Immunofluorescence images of hippocampal dendritic spines transfected with mRFP-β-actin (left) or superimposed with surface GluA1 pseudo-colored in green (right) for control and GI-LTP-treated neurons. Scale bar, 15 μm; inset, 2.5 μm. B, Quantification of spine head area and surface GluA1 (n = 75–100 spines per neuron; 6–8 neurons per coverslip) for control and GI-LTP-treated neurons (n = 8 coverslips per condition from 2 independent cultures). C, Scatter plot of surface GluA1 and spine head area for control and GI-LTP-treated coverslips. D, Representative Western blots of biotinylated surface GluA1 (GluA1bio) and total GluA1 (GluA1tot) for conditions shown. E, Quantification of the ratio of surface biotinylated to total GluA1 for each condition indicated (n = 8 from 5 independent experiments). For GI-LTP-treated cultures, neurons were fixed or biotinylated 40 min after GI-LTP. Error bars indicate SEM. *p < 0.05 by Student's t test.
Figure 5.
Figure 5.
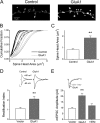
Overexpression of GluA1 increases spine head area, mEPSC amplitude, and synaptic expression of CP-AMPARs. A, Fluorescence images of dendritic spines expressing mRFP-β-actin plus vector (left) or GluA1 (right). B, Cumulative distribution plots for control neurons (black) and neurons expressing GluA1 (gray). C, Mean data for neurons plotted in B. Error bars indicate SEM (n = 8 per condition from 2 independent experiments; **p < 0.01 by Student's t test). D, Top, Example of mEPSCs recorded from a vector only (control) or GluA1-expressing neuron at two different holding potentials (−60 and 60 mV). Bottom, Mean rectification index, an indicator of CP-AMPARs, for vector only and GluA1 expressing neurons. Rectification index was calculated by dividing the absolute mean peak amplitude recorded at 60 mV by the peak amplitude recorded at −60 mV for individual neurons. Error bars indicate SEM (n = 6 recordings per condition; **p < 0.01 by Student's t test). E, Top, Example traces of mEPSCs recorded at −60 mV from a GluA1-expressing neuron illustrating sensitivity toward IEM-1460 (30 μm), an antagonist of CP-AMPARs. Bottom, Pooled data for mean mEPSC amplitudes for vector (n = 6), GluA1 (n = 6; **p < 0.01 by Student's t test) and GluA1 in the presence of IEM-1460 (IEM; n = 4; **p < 0.01 by paired Student's t test).
Figure 6.
Figure 6.
GI-LTP increases mEPSCs and recruitment of synaptic CP-AMPARs. A, Individual mEPSC amplitudes plotted before (Baseline) and 40 min after GI-LTP. Mean amplitudes are denoted by black filled circles. Error bars indicated SEM (n = 7 from 3 independent cultures). *p < 0.05 by paired Student's t test. Inset, Example mEPSC traces before and after GI-LTP. Traces are an average of 50 consecutive events. B, Plot of mEPSCs as described in A before (Baseline) and after GI-LTP in the presence of IEM-1460 (IEM). Error bars indicate SEM (n = 6 from 3 independent cultures). C, Pooled data of spine head area (n = 50–75 spines per neuron; 5–8 neurons per coverslip) for controls and neurons after GI-LTP in absence or presence of IEM-1460. Error bars indicate SEM (n = 6–8 coverslips/ condition). ***p < 0.001 by Student's t test. D, Cumulative distribution of spine head areas for each condition indicated.
Figure 7.
Figure 7.
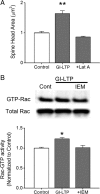
GI-LTP structural plasticity requires actin polymerization and CP-AMPAR-mediated activation of Rac. A, Group data of spine head area (n = 50–75 spines per neuron; 5 neurons per coverslip) for controls and neurons subjected to GI-LTP in absence or presence of 10 μm latrunculin A. Error bars indicate SEM (n = 5 coverslips/condition). **p < 0.01 by Student's t test. B, Top, Representative Western blot of activated GTP-bound Rac, determined by affinity pulldown using GST-tagged CRIB domain of PAK1, and total Rac for conditions indicated. Bottom, Group data plotted as the ratio of GTP-Rac to total Rac for each condition normalized to the mean control. Error bars indicate SEM (n = 4–6 independent experiments per condition). *p < 0.05 by Student's t test.
Figure 8.
Figure 8.
GI-LTP structural plasticity requires the PAK/LIM-kinase Pathway. A, Top, Western blots of pPAK (S141) and β-tubulin (loading control) for conditions indicated. Bottom, Group data shown as the ratio of pPAK to β-tubulin for each condition normalized to the mean control. B, Top, In these same experiments cell lysates were also probed by Western blots for pLIMK (Y507/T508). Bottom, Pooled data for ratios of pLIMK to β-tubulin for each condition normalized to the mean control. Error bars in A and B indicate SEM (n = 6–7 independent experiments). *p < 0.05 by Student's t test. C, Mean spine head area for control and neurons after GI-LTP treatment in the absence or presence of dnPAK (n = 50–75 spines per neuron; 5–6 neurons per coverslip). Error bars indicate SEM (n = 8–10 coverslips per condition from 2–3 independent cultures). *p < 0.05 by Student's t test. D, Cumulative distribution of spine head areas for each condition indicated.

Similar articles

Cited by

References

    1. Abramoff MD, Magelhaes PJ, Ram SJ. Image processing with ImageJ. Biophotonics Int. 2004;11:36–42.
    1. Adesnik H, Nicoll RA. Conservation of glutamate receptor 2-containing AMPA receptors during long-term potentiation. J Neurosci. 2007;27:4598–4602. - PMC - PubMed
    1. Ageta-Ishihara N, Takemoto-Kimura S, Nonaka M, Adachi-Morishima A, Suzuki K, Kamijo S, Fujii H, Mano T, Blaeser F, Chatila TA, Mizuno H, Hirano T, Tagawa Y, Okuno H, Bito H. Control of cortical axon elongation by a GABA-driven Ca2+/calmodulin-dependent protein kinase cascade. J Neurosci. 2009;29:13720–13729. - PMC - PubMed
    1. Allen KM, Gleeson JG, Bagrodia S, Partington MW, MacMillan JC, Cerione RA, Mulley JC, Walsh CA. PAK3 mutation in nonsyndromic X-linked mental retardation. Nat Genet. 1998;20:25–30. - PubMed
    1. Bamburg JR, McGough A, Ono S. Putting a new twist on actin: ADF/cofilins modulate actin dynamics. Trends Cell Biol. 1999;9:364–370. - PubMed

Publication types

MeSH terms

Substances

LinkOut - more resources