. 2010 Sep;136(3):339-52.
doi: 10.1085/jgp.201010442.

Fatty acid modulation and polyamine block of GluK2 kainate receptors analyzed by scanning mutagenesis

Affiliations

Fatty acid modulation and polyamine block of GluK2 kainate receptors analyzed by scanning mutagenesis

Timothy J Wilding et al. J Gen Physiol. 2010 Sep.

Abstract

RNA editing of kainate receptor subunits at the Q/R site determines their susceptibility to inhibition by cis-unsaturated fatty acids as well as block by cytoplasmic polyamines. Channels comprised of unedited (Q) subunits are strongly blocked by polyamines, but insensitive to fatty acids, such as arachidonic acid (AA) and docosahexaenoic acid (DHA), whereas homomeric edited (R) channels resist polyamine block but are inhibited by AA and DHA. In the present study, we have analyzed fatty acid modulation of whole-cell currents mediated by homomeric recombinant GluK2 (formerly GluR6) channels with individual residues in the pore-loop, M1 and M3 transmembrane helices replaced by scanning mutagenesis. Our results define three abutting surfaces along the M1, M2, and M3 helices where gain-of-function substitutions render GluK2(Q) channels susceptible to fatty acid inhibition. In addition, we identify four locations in the M3 helix (F611, L614, S618, and T621) at the level of the central cavity where Arg substitution increases relative permeability to chloride and eliminates polyamine block. Remarkably, for two of these positions, L614R and S618R, exposure to fatty acids reduces the apparent chloride permeability and potentiates whole-cell currents approximately 5 and 2.5-fold, respectively. Together, our results suggest that AA and DHA alter the orientation of M3 in the open state, depending on contacts at the interface between M1, M2, and M3. Moreover, our results demonstrate the importance of side chains within the central cavity in determining ionic selectivity and block by cytoplasmic polyamines despite the inverted orientation of GluK2 as compared with potassium channels and other pore-loop family members.


Figures
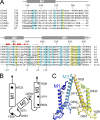
Figure 1.
Figure 1.
Homology among glutamate receptor and potassium channel subunits. (A) Amino acid sequence alignments of GluK2 with AMPA receptor subunit GluA1, GluA2, and GluA4, NMDA receptor subunits GluN1, GluN2B, and GluN2C, and potassium channel subunit KcsA. Yellow and light teal shading indicate positions with amino acid identity or conservative substitutions, respectively, with the following groups as conservative replacements: (A, C, G, S, T), (I, L, M, V), (F, W, Y), (H, K, R). Gray shaded boxes above the alignment indicate the presumed extent of the pore-loop helix (M2) and downstream transmembrane α helix (M3) based on homology to the GluA2 crystal structure. Residues are numbered for the mature GluK2 protein. Underlined residues in GluA1 (Sobolevsky et al., 2003), GluA4 (Kuner et al., 2001), GluN1 (Kuner et al., 1996; Beck et al., 1999), GluN2B (Chang and Kuo, 2008), and GluN2C (Kuner et al., 1996; Sobolevsky et al., 2002), when substituted with Cys, exhibit modification by methanethiosulfonate reagents applied from either the cytoplasmic (M2 residues) or extracellular (M3 residues) solutions. Symbols immediately above the alignment denote locations where Arg substitution strongly (dark red) or weakly (light red) enhanced susceptibility of GluK2(Q) to DHA inhibition (see Wilding et al., 2008). Squares, presumed α-helical residues; circles, presumed open coil residues; diamond, the Q/R/N site; filled symbols, upstream locations; open symbols, downstream. (B) Membrane topology of glutamate receptor subunit M1–M3 domain. Subunits were analyzed with single Ala and Trp point mutations between residues D567 and R603, and with Arg substitutions between residues W533-Y559 and V571-T629. (C) Homology model of the GluK2 M1–M3 domain; two nonadjacent subunits are shown.
Figure 2.
Figure 2.
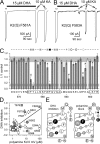
Pore-loop locations where Ala substitution enhances DHA inhibition of GluK2(Q). Whole-cell currents evoked by 10 µM kainate before and after exposure to 15 µM DHA in Con A–treated HEK cells expressing homomeric GluK2(Q) receptors with Ala substitutions at F581 (A) or F583 (B). (C) Current evoked by the first kainate application after exposure to DHA plotted as a fraction of control current before DHA. *, significantly different from Q590 but not Q590R, one-way ANOVA on ranks, P < 0.05 by Dunn’s method of post-hoc comparison to control. #, significantly different from both Q590 and Q590R, rank sum test, P < 0.05. Symbols above the plot denote locations where Ala substitution produced a strong (black) or intermediate (gray) reduction in polyamine block of GluK2(Q) (see Panchenko et al., 2001). Squares, presumed α-helical residues; circles, presumed open coil residues; diamond, the Q/R/N site; filled symbols, upstream locations; open symbols, downstream. (D) DHA inhibition (1 – I/Icontrol) plotted versus polyamine Kd calculated at 0 mV. Upstream residues are shaded, downstream are open. Correlation coefficient from linear regression of the upstream residues was 0.66. (E) Net diagrams of the pore helix and adjacent residues. Circle diameter for each residue proportional to side chain volume. (Left) Filled circles indicate locations where Ala substitution allowed strong (black) or intermediate (gray) inhibition by DHA (Right) Filled circles indicate strong (black) or intermediate (gray) reduction in polyamine block when substituted by Ala.
Figure 3.
Figure 3.
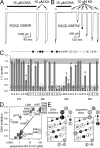
Pore-loop locations where Trp substitution enhances DHA inhibition of GluK2(Q). Whole-cell currents evoked by 10 µM kainate before and after exposure to 15 µM DHA in Con A–treated HEK cells expressing homomeric GluK2(Q) receptors with Trp substitutions at V585 (A) or A587 (B). (C) Current evoked by the first kainate application after exposure to DHA plotted as a fraction of control current before DHA. *, significantly different from Q590 but not Q590R, one-way ANOVA on ranks, P < 0.05 by Dunn’s method of post-hoc comparison to control. #, significantly different from both Q590 and Q590R, rank sum test, P < 0.05. Currents for Trp substitution at A599 or S601 were too small to analyze (X). Symbols above the plot denote locations where Trp substitution produced a strong (black) or intermediate (gray) reduction in polyamine block of GluK2(Q) (see Panchenko et al., 2001). Squares, presumed α-helical residues; circles, presumed open coil residues; diamond, the Q/R/N site; filled symbols, upstream locations; open symbols, downstream. (D) DHA inhibition (1 – I/Icontrol) plotted versus polyamine Kd calculated at 0 mV. Upstream residues are shaded, downstream are open. Correlation coefficient from linear regression of the upstream residues was 0.90. (E) Net diagrams of the pore helix and adjacent residues. Circle diameter for each residue proportional to side chain volume. (Left) Filled circles indicate locations where Trp substitution allowed strong (black) or intermediate (gray) inhibition by DHA. (Right) Filled circles indicate strong (black) or intermediate (gray) reduction in polyamine block when substituted by Trp.
Figure 4.
Figure 4.
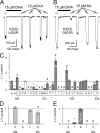
Inhibition and potentiation of GluK2(Q) with Arg substitutions in M3. Whole-cell currents evoked by 10 µM kainate before and after exposure to 15 µM DHA in Con A–treated HEK cells expressing homomeric GluK2(Q) receptors with Arg substitutions at L600 (A) or G607 (B). (C) Current evoked by the first kainate application after exposure to DHA plotted as a fraction of control current before DHA. *, significantly different from Q590 but not Q590R, one-way ANOVA on ranks, P < 0.05 by Dunn’s method of post-hoc comparison to control. #, significantly different from both Q590 and Q590R, rank sum test, P < 0.05. Results for Glu substitution mutants of GluK2(Q) (D) and for Arg substitutions to GluK2(Q) R603W (E). X denotes positions where amino acid substitution resulted in kainate-evoked currents that were too small to analyze.
Figure 5.
Figure 5.
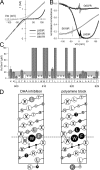
Arg substitutions in M3 disrupt polyamine block. (A) Whole-cell currents evoked by 10 µM kainate during a voltage ramp from −120 to +120 mV for Arg substitutions at L600, G607, and S618 of GluK2(Q). (B) Plots of conductance versus voltage for the three mutants in A normalized to the L600R and G607R values at −120 mV. Smooth curves for L600R and G607R illustrate fits of an equation describing permeant block (see Materials and methods). (C) Kd 0 mV values for polyamine block of Arg substitution mutants from K598 through T629 calculated from Boltzmann fits as illustrated in B. (D) Net diagrams of the M3 helix and adjacent residues. Circle diameter for each residue proportional to side chain volume. (Left) Filled circles indicate locations where Arg substitution allowed strong (black) or intermediate (gray) inhibition by DHA. Hatched circles indicate potentiation by DHA. (Right) Filled circles indicate strong (black) or intermediate (gray) reduction in polyamine block when substituted by Arg. X denotes positions where amino acid substitution resulted in kainate-evoked currents that were too small to analyze. Horizontal dashed line indicates the approximate level of the Q/R site or the top of the M2 loop relative to M3.
Figure 6.
Figure 6.
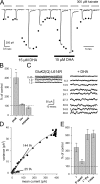
DHA increases unitary current amplitude to potentiate GluK2(Q) L614R. (A) Filled circles plot peak whole-cell current amplitudes evoked by 34 rapid applications of 300 µM kainate to a cell that was not pretreated with ConA. Exposure to 15 µM DHA during the periods indicated by filled bars increased peak inward currents. Gray symbols plot peak whole-cell current amplitude for the nine representative traces that are shown superimposed on the time course plot. (B) Peak current, time constant for a single exponential fit to the decay to steady-state, and steady-state/peak ratio (ss/peak) during exposure to DHA as a percent of control (before and/or after DHA) for experiments as in A, n = 7 cells. (C) Whole-cell currents evoked by 10 µM kainate before (left) or during (right) exposure to 15 µM DHA in a Con A–treated cell. (D) Plot of current variance versus mean current for the cell shown in C. Open circles recorded before and filled circles during exposure to DHA. The parabolic smooth curve is the best fit of σ2 = i*I – I2/N, where i is the estimated unitary current amplitude and N is the estimated number of channels. The straight line with slope of 144 fA tangent to the parabolic smooth curve is the estimated i from the parabolic fit for DHA. The line with slope of 25 fA is the estimated i for the control data. (E) Estimated unitary current (i) and open probability (P open) during exposure to kainate and DHA as a percentage of control (kainate alone), n = 6 cells. The increase in i and more modest increase in P open together account for the potentiation observed in maximal current.
Figure 7.
Figure 7.
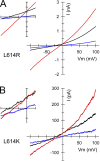
Potentiation of GluK2(Q) L614R and L614K associated with a positive shift in reversal potential. Whole-cell currents elicited by 10 µM kainate between −100 and +100 mV as the membrane potential was ramped at ∼1 mV/ms; internal cesium glucuronate. (A) Kainate-evoked current mediated by GluK2(Q) L614R before (black) and after (red) exposure to DHA using external NaCl. Following recovery from DHA potentiation, kainate-evoked current was recorded using extracellular sodium glucuronate (blue). (B) Similar experiment for GluK2(Q) L614K.
Figure 8.
Figure 8.
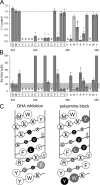
Arg substitution along one face of M1 supports DHA inhibition of GluK2(Q). (A) Current evoked by the first kainate application after exposure to DHA plotted as a fraction of control current before DHA. *, significantly different from Q590 but not Q590R, one-way ANOVA on ranks, P < 0.05 by Dunn’s method of post-hoc comparison to control. #, significantly different from both Q590 and Q590R, rank sum test, P < 0.05. (B) Kd 0 mV values for polyamine block of Arg substitution mutants from W533 through Y559 calculated from Boltzmann fits as illustrated in Fig. 5 B. (C) Net diagrams of the M1 helix. Circle diameter for each residue proportional to side chain volume. (Left) Filled circles indicate locations where Arg substitution allowed strong (black) or intermediate (gray) inhibition by DHA. (Right) Filled circles indicate strong (black) or intermediate (gray) reduction in polyamine block when substituted by Arg. X denotes positions where amino acid substitution resulted in kainate-evoked currents that were too small to analyze.
Figure 9.
Figure 9.
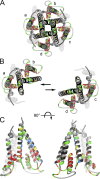
Locations where Arg substitution regulates fatty acid inhibition and potentiation. Homology model of the transmembrane portions of GluK2(Q) based on the x-ray crystal structure of GluA2. (A) View down the central axis of the pore from outside the cell. (B) Same orientation as A, but with the a, b and c, d subunit pairs separated by lateral displacement. (C) Side view of the subunit pairs in B, after 90° rotation, illustrating residues that face the pore (left) or surrounding lipids (right). Locations where Arg substitution promoted strong or intermediate inhibition by DHA are colored red and yellow, respectively. Green indicates positions where Arg substitution did not alter susceptibility of GluK2(Q) to DHA. Little or no whole-cell current was elicited from subunits with Arg substituted a locations colored black. Blue indicates the three Arg substitution positions in M3 where exposure to DHA resulted in potentiation of whole-cell currents. Residues colored gray were not substituted in this study. M4 helices are semi-transparent, for clarity.

Similar articles

Cited by

References

    1. Bähring R., Bowie D., Benveniste M., Mayer M.L. 1997. Permeation and block of rat GluR6 glutamate receptor channels by internal and external polyamines. J. Physiol. 502:575–589 10.1111/j.1469-7793.1997.575bj.x - DOI - PMC - PubMed
    1. Beck C., Wollmuth L.P., Seeburg P.H., Sakmann B., Kuner T. 1999. NMDAR channel segments forming the extracellular vestibule inferred from the accessibility of substituted cysteines. Neuron. 22:559–570 10.1016/S0896-6273(00)80710-2 - DOI - PubMed
    1. Bennett J.A., Dingledine R. 1995. Topology profile for a glutamate receptor: three transmembrane domains and a channel-lining reentrant membrane loop. Neuron. 14:373–384 10.1016/0896-6273(95)90293-7 - DOI - PubMed
    1. Boland L.M., Drzewiecki M.M. 2008. Polyunsaturated fatty acid modulation of voltage-gated ion channels. Cell Biochem. Biophys. 52:59–84 10.1007/s12013-008-9027-2 - DOI - PubMed
    1. Bowie D., Mayer M.L. 1995. Inward rectification of both AMPA and kainate subtype glutamate receptors generated by polyamine-mediated ion channel block. Neuron. 15:453–462 10.1016/0896-6273(95)90049-7 - DOI - PubMed

Publication types

MeSH terms