. 2010 Nov 5;285(45):34939-49.
doi: 10.1074/jbc.M110.162933. Epub 2010 Aug 27.

Human alveolar type II cells secrete and absorb liquid in response to local nucleotide signaling

Affiliations

Human alveolar type II cells secrete and absorb liquid in response to local nucleotide signaling

Peter F Bove et al. J Biol Chem. .

Abstract

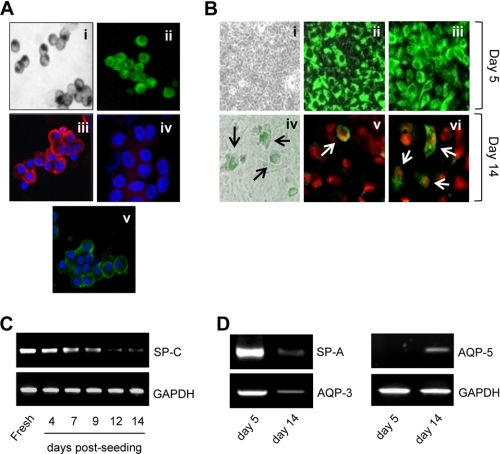
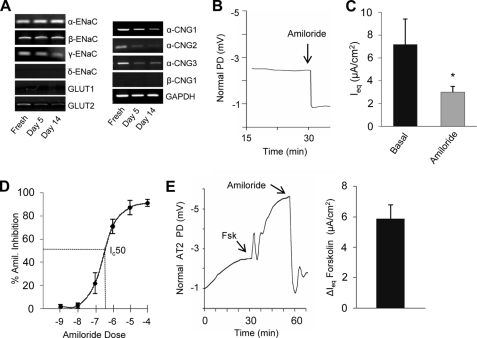
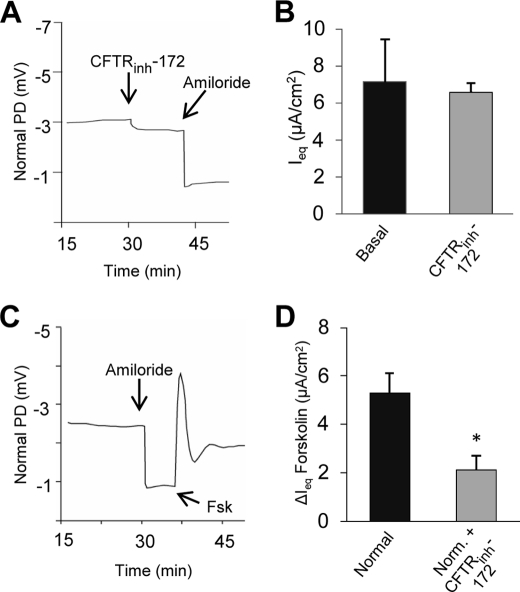
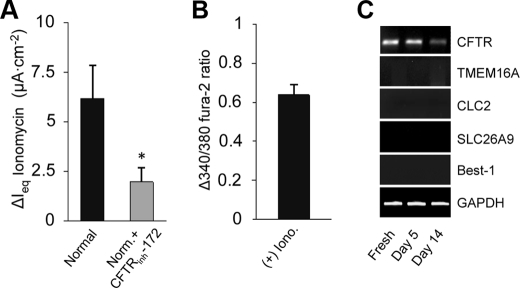
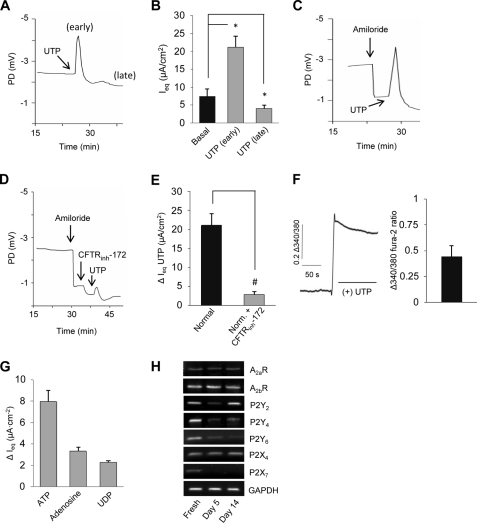
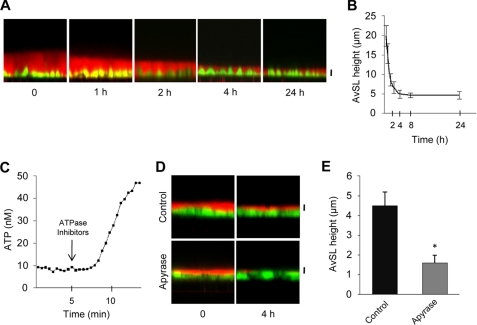
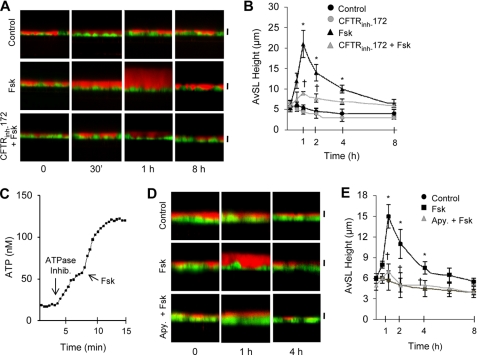
A balance sheet describing the integrated homeostasis of secretion, absorption, and surface movement of liquids on pulmonary surfaces has remained elusive. It remains unclear whether the alveolus exhibits an intra-alveolar ion/liquid transport physiology or whether it secretes ions/liquid that may communicate with airway surfaces. Studies employing isolated human alveolar type II (AT2) cells were utilized to investigate this question. Human AT2 cells exhibited both epithelial Na(+) channel-mediated Na(+) absorption and cystic fibrosis transmembrane conductance regulator-mediated Cl(-) secretion, both significantly regulated by extracellular nucleotides. In addition, we observed in normal AT2 cells an absence of cystic fibrosis transmembrane conductance regulator regulation of epithelial Na(+) channel activity and an absence of expression/activity of reported calcium-activated chloride channels (TMEM16A, Bestrophin-1, ClC2, and SLC26A9), both features strikingly different from normal airway epithelial cells. Measurements of alveolar surface liquid volume revealed that normal AT2 cells: 1) achieved an extracellular nucleotide concentration-dependent steady state alveolar surface liquid height of ∼4 μm in vitro; 2) absorbed liquid when the lumen was flooded; and 3) secreted liquid when treated with UTP or forskolin or subjected to cyclic compressive stresses mimicking tidal breathing. Collectively, our studies suggest that human AT2 cells in vitro have the capacity to absorb or secrete liquid in response to local alveolar conditions.


Figures

FIGURE 1.
FIGURE 1.
Characterization of human AT2 cells. A, the purity of freshly isolated normal human AT2 cells (panel i) was determined by immunostaining using a proSP-C antibody. Freshly isolated normal AT2 cells were also probed using Lysotracker® Green DND-26 (panel ii), antibodies probing for AQP-3 (panel iii), AQP-5 (panel iv), or CFTR (panel v) protein expression to assess AT2 purity. B, normal human AT2 cells were cultured in DMEM + 5% FBS medium on rat tail collagen-1-coated 1.12-cm2 membrane Transwell inserts and exposed to air-liquid interface 96 h post-seeding. Differential interference contrast (panel i, 20× objective), Lysotracker® (panel ii), and proSP-C (panel iii) imaging were performed to assess the purity of AT2 cultures 5 days after seeding by confocal microscopy. Normal human AT2 cells 14 days in culture were probed using Lysotracker® (panel iv), proSP-C (panel v), or AQP-5 (panel vi) to assess the trans-differentiation process of AT2 cells in culture over time into AT1-like cells (arrows indicate positive cells). C, mRNA from freshly isolated human AT2 cells, as well as mRNA from cells 4–14 days post-seeding, were collected. SP-C gene expression was measured using semi-quantitative PCR. D, semi-quantitated PCR was also measured for SP-A, AQP-3, and AQP-5 gene expression in normal AT2 cultures 5 or 14 days after seeding to characterize cell phenotype. All of the original images were taken using a 63× objective, unless otherwise stated.
FIGURE 2.
FIGURE 2.
Na+ transport properties of human AT2 cells. A, semi-quantitative PCR analysis was performed to identify the expression of genes whose products could mediate electrogenic Na+ absorption in freshly isolated or cultured human AT2 cells. B, normal AT2 cultures were mounted in Ussing chambers, transepithelial electric PDs measured under open circuit conditions, with response to amiloride (100 μm, luminal). C, basal and amiloride-sensitive equivalent short circuit currents (Ieq) were measured in normal AT2 cultures mounted in Ussing chambers (means ± S.D.; n ≥ 6; *, p < 0.05). D, an amiloride dose-response curve was generated in normal AT2 cultures (mean ± S.D.; n ≥ 3). E, the potential difference (mV) and the change in equivalent short circuit current (ΔIeq) were measured after exposure to forskolin (10 μm) followed by treatment with amiloride (100 μm, luminal) in normal AT2 cultures (n ≥ 6).
FIGURE 3.
FIGURE 3.
Cl transport properties of human AT2 cells. A, normal human AT2 cultures were studied under basal conditions and after exposure to the CFTR inhibitor (CFTRinh-172, 10 μm) followed by the addition of amiloride (100 μm) in Ussing chambers. B, equivalent short circuit currents (Ieq) in normal AT2 cells under basal versus post-CFTRinh-172 addition are summarized (means ± S.D.; n ≥ 6). C, Ussing chamber studies were performed to measure the forskolin-mediated secretory capacity of normal AT2 cultures in the presence of amiloride. D, the change in the equivalent short circuit current (ΔIeq) induced by forskolin in normal AT2 cultures, with or without CFTRinh-172 (10 μm) (mean ± S.D.; n ≥ 6; *, p < 0).
FIGURE 4.
FIGURE 4.
Calcium-mediated Cl secretion in human AT2 cells. A, the changes in equivalent short circuit currents (ΔIeq) were measured and quantitated by Ussing chamber analysis in response to ionomycin (5 μm, luminal) in normal AT2 cells and normal AT2 cells pretreated with CFTRinh-172 in the presence of amiloride (means ± S.D.; n ≥ 3; *, p < 0.05). B, intracellular Ca2+ responses (Δ340/380 fura-2 ratio) of fura-loaded normal AT2 cells were measured, and the responses were summarized (means ± S.D.; n ≥ 3). C, semi-quantitative PCR analysis was performed to identify chloride channel genes (CFTR, TMEM16A, CLC2, and SLC26A9) expressed in freshly isolated or cultured normal AT2 cells.
FIGURE 5.
FIGURE 5.
Nucleotide/nucleoside-mediated regulation of human AT2 cell ion transport. A, potential differences were measured in normal AT2 cultures before and after exposure to UTP (100 μm, luminal) in Ussing chambers. B, the “early” and “late” responses to UTP were quantitated. Summary data describing equivalent short circuit current (Ieq) in normal AT2 cells before and after (early/late) UTP exposure (means ± S.D.; n ≥ 6; *, p < 0.05). C and D, UTP effect on potential differences in amiloride-pretreated normal AT2 cultures (C) and normal AT2 cultures treated with CFTRinh-172 (D). E, changes in equivalent short circuit current for UTP responses without and with CFTRinh-172 pretreatment conditions (means ± S.D.; n ≥ 6; #, p < 0.01). F, Ca2+ mobilization (Δ340/380 fura-2 ratio) was measured in normal AT2 cultures following the addition of UTP (100 μm, luminal). G, ATP (100 μm), adenosine (100 μm), or UDP (100 μm) was added apically to normal AT2 cultures, and ΔIeq was measured and summarized (mean ± S.D.; n ≥ 3). H, semi-quantitative PCR analysis to identify gene expression of nucleotide/nucleoside purinergic receptors present in normal AT2 cells freshly isolated and over time in culture.
FIGURE 6.
FIGURE 6.
Regulation of basal AvSL height by normal human AT2 cultures. Live human AT2 cells were labeled with Calcein Green, and then the AvSL was labeled with a Texas Red-labeled 70-kDa dextran fluorophore. A, AvSL height was measured serially after the addition of the Texas Red-labeled 70-kDa dextran fluorophore (25 μl) by confocal microscopy. B, the mean changes in AvSL height were measured and plotted over 24 h. C, luminal extracellular ATP levels were measured in normal AT2 cultures using the luciferase/luciferin assay in the absence (basal levels) and presence of ATPase inhibitors (measure of ATP release rate). D, AvSL height was imaged by confocal microscopy over 4 h in the absence or presence of apyrase (10 units/ml). E, AvSL height was quantitated at 4 h before and after apyrase treatment (mean ± S.D.; n ≥ 3; *, p < 0.05). All of the original images were z scans taken using a 63× objective. All of the scale bars represent 5 μm.
FIGURE 7.
FIGURE 7.
Regulation of AvSL height by forskolin by normal human AT2 cultures. Normal human AT2 cells were labeled with Calcein Green, and AvSL was labeled with 25 μl of Texas Red-labeled 70-kDa dextran fluorophore for 30 min prior to aspiration. A, control and post-forskolin AvSL height starting from basal thin film conditions were imaged by confocal microscopy in confluent normal AT2 cultures over 8 h. B, confluent normal AT2 cultures were treated without (control) or with forskolin, in the absence or presence of CFTRinh-172, and AvSL height was measured over 8 h (mean ± S.D.; n ≥ 3; *, p < 0.05 different from control; †, p < 0.05 different from forskolin (Fsk) treatment). C, luminal ATP release rates were measured before and after exposure to forskolin (10 μm) in the continued presence of ATPase inhibitors. D, confocal images showing control, forskolin (10 μm), and apyrase (10 units/ml)/forskolin-treated normal AT2 cells. E, summary data plotting AvSL height versus time in control, forskolin-treated, and apyrase/forskolin-treated normal AT2 cultures (means ± S.D.; n ≥ 3; *, p < 0.05 different from control; †, p < 0.05 different from forskolin treatment). All of the scale bars represent 5 μm.
FIGURE 8.
FIGURE 8.
Cyclic compressive stress/nucleotide regulation of AvSL height of normal human AT2 cultures. Normal human AT2 cells were labeled with Calcein Green, and AvSL was labeled with (25 μl) Texas Red-labeled 70-kDa dextran fluorophore for 30 min and then aspirated. A, control and post-UTP addition (100 μm, luminal) in AvSL heights were imaged by confocal microscopy in confluent normal AT2 cultures. B, confluent normal AT2 cultures were treated without (Control) or with UTP in the absence or presence of CFTRinh-172, and AvSL height was measured (mean ± S.D.; n ≥ 3; *, p < 0.05 different from control; †, p < 0.05 different from UTP treatment). C, normal human AT2 cultures were subjected to constant CCS (0–20 cm H20) for 24 h, and AvSL height was imaged using confocal microscopy. D, summary data for normal AT2 cultures exposed to control (static) conditions and CCS for 24 h without (Control) or with apyrase (Apy., 10 units/ml) treatment (means ± S.D.; n ≥ 3; *, p < 0.05 different from control; †, p < 0.05 different from CCS). All of the scale bars represent 5 μm. (Basolateral fluorescence occurs if minor disruption occurs in the seal between the cell monolayer and the Transwell membrane. This event occurs rarely and does not affect the overall integrity of the experiment.)

Similar articles

Cited by

References

    1. Tarran R., Button B., Picher M., Paradiso A. M., Ribeiro C. M., Lazarowski E. R., Zhang L., Collins P. L., Pickles R. J., Fredberg J. J., Boucher R. C. (2005) J. Biol. Chem. 280, 35751–35759 - PMC - PubMed
    1. Knowles M. R., Boucher R. C. (2002) J. Clin. Invest. 109, 571–577 - PMC - PubMed
    1. Matthay M. A., Robriquet L., Fang X. (2005) Proc. Am. Thorac. Soc. 2, 206–213 - PubMed
    1. Mason R. J. (2006) Respirology 11, S12–S15 - PubMed
    1. Dobbs L. G., Johnson M. D. (2007) Respir. Physiol. Neurobiol. 159, 283–300 - PubMed

Publication types

LinkOut - more resources