. 2010 Oct;60(1):8-20.
doi: 10.1016/j.jdermsci.2010.07.007. Epub 2010 Jul 22.

Induced Sézary syndrome PBMCs poorly express immune response genes up-regulated in stimulated memory T cells

Affiliations

Induced Sézary syndrome PBMCs poorly express immune response genes up-regulated in stimulated memory T cells

Benjamin F Chong et al. J Dermatol Sci. 2010 Oct.

Abstract

Background: Dysfunctions in memory T cells contribute to various inflammatory autoimmune diseases and neoplasms. We hypothesize that investigating the differences of genetic profiles between resting and activated naïve and memory T cells may provide insight into the characterization of abnormal memory T cells in diseases, such as Sézary syndrome (SS), a neoplasm composed of CD4(+) CD45RO(+) cells.

Objective: We determined genes distinctively expressed between resting and activated naive and memory cells. Levels of up-regulated genes in resting and activated memory cells were measured in SS PBMCs, which were largely comprised of CD4(+) CD45RO(+) cells, to quantitatively assess how different Sézary cells were from memory cells.

Methods: We compared gene expression profiles using high-density oligo-microarrays between resting and activated naïve and memory CD4(+) T cells. Differentially expressed genes were confirmed by qRT-PCR and immunoblotting. Levels of genes up-regulated in activated and resting memory T cells were determined in SS PBMCs by qRT-PCR.

Results: Activated memory cells expressed greater numbers of immune-mediated genes involved in effector function compared to naïve cells in our microarray analysis and qRT-PCR. Nine out of 14 genes with enhanced levels in activated memory cells had reduced levels in SS PBMCs (p<0.05).

Conclusions: Activation of memory and naïve CD4(+) T cells revealed a diverging gap in gene expression between these subsets, with memory cells expressing immune-related genes important for effector function. Many of these genes were markedly depressed in SS patients, implying Sézary cells are markedly impaired in mounting immune responses compared to memory cells.


Figures

Fig. 1
Fig. 1
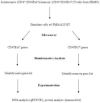
Schematic overview of steps for T cell purification, microarray analysis, gene expression analysis, and confirmatory testing of resting and activated naïve and memory T cells. Peripheral blood mononuclear cells (PBMCs) isolated from normal patients were purified into CD4+ naïve (CD45RA+) and memory (CD45RO+) T cell populations by negative selection and stimulated with PMA/A23187 for zero, two, and six hours as described in the Materials and Methods. Microarray analysis as described in the Materials and Methods generated lists of genes up-regulated at least five-fold in resting and activated naïve versus memory cells and vice versa. Candidate genes were selected for qRT-PCR and immunoblot verification.
Fig. 2
Fig. 2
Gene expression analysis by self-organizing map and Venn diagrams of genes that were significantly different between naïve and memory cells through two-way ANOVA analysis. (a) A self-organizing map of nine clusters, 100,000 iterations, and neighborhood radius of four was produced to evaluate gene expression patterns when naïve and memory cells were stimulated with PMA/A23187 for zero, two, and six hours . (b) Venn diagrams were produced to demonstrate the number of genes differentially expressed by at least five or ten-fold between naïve (RA) and memory (RO) cells at zero, two, and six hours of stimulation. All genes had p-values < 0.05 based on two-way ANOVA analysis of variance and Benjamini-Hochberg (BH) method .
Fig. 3
Fig. 3
Heat maps of genes expressed differentially by at least five-fold. Heat maps were produced for genes up-regulated in resting naïve (RA) cells compared to resting memory (RO) cells (a), resting RO cells compared to resting RA cells (b), activated RA cells compared to activated RO cells (c), and activated RO cells compared to activated RA cells (d). Each row of the heat map corresponds to the table row containing the gene name, GenBank accession number, mean fold change (denoted as mean fold Δ and represented by ratios of mean expression of naïve versus memory cells (a, c), or memory versus naïve cells (b, d)), and p-value. The blue bars denoted low expression, while the red bars represented high expression. p-values were obtained from two-way ANOVA analysis of variance and Benjamini-Hochberg (BH) method.
Fig. 3
Fig. 3
Heat maps of genes expressed differentially by at least five-fold. Heat maps were produced for genes up-regulated in resting naïve (RA) cells compared to resting memory (RO) cells (a), resting RO cells compared to resting RA cells (b), activated RA cells compared to activated RO cells (c), and activated RO cells compared to activated RA cells (d). Each row of the heat map corresponds to the table row containing the gene name, GenBank accession number, mean fold change (denoted as mean fold Δ and represented by ratios of mean expression of naïve versus memory cells (a, c), or memory versus naïve cells (b, d)), and p-value. The blue bars denoted low expression, while the red bars represented high expression. p-values were obtained from two-way ANOVA analysis of variance and Benjamini-Hochberg (BH) method.
Fig. 4
Fig. 4
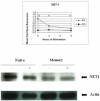
Confirmatory testing of up-regulated genes in resting naïve versus memory cells. (a) qRT-PCR was performed for neuroepithelial cell transforming gene 1 (NET1) that was up-regulated in resting naïve versus memory cells. Expression of these genes was measured against time of stimulation. Error bars represented standard error of the mean. p-values were also calculated for each time point (*: p<0.05). (b) Immunoblotting analysis evaluated NET1 expression in naïve and memory cells, which were either resting (−) or activated (+) with PMA/A23187 for six hours. Actin was employed as a positive control.
Fig. 5
Fig. 5
Confirmatory testing of up-regulated genes in resting memory versus naïve cells. (a) mRNA expression of two candidate genes, chemokine (C-C) motif receptor 6 (CCR6), and v-maf musculoaponeurotic fibrosarcoma oncogene homolog (avian) (v-maf), that were up-regulated in resting memory versus naïve cells was measured by qRT-PCR. Expression of these genes was measured against time of stimulation. Error bars represented standard error of the mean. p-values were also calculated for each time point (*: p<0.05, **: p<0.005). (b) Flow cytometry analysis of CCR6 in resting and activated naïve and memory cells was performed.
Fig. 6
Fig. 6
Confirmatory testing of up-regulated genes in activated memory versus activated naïve cells. (a) qRT-PCR was performed to confirm elevated mRNA expression of genes up-regulated in activated memory versus naïve cells. The temporal expressions of interleukin-22 (IL-22), neuropilin and tolloid-like-2 (NETO2), and chemokine (C-X-C motif) receptor 5 (CXCR5) that were up-regulated at both two and six hours, two hours only, and six hours only, respectively, were displayed as linear graphs. Error bars represented standard error of the mean. p-values were also calculated for each time point (*: p<0.05). (b) Western blot analysis of TNFSF11 was performed in naïve and memory cells, which were either resting (−) or activated (+) with PMA/A23187 for six hours (b).
Fig. 7
Fig. 7
Quantitative comparison of SS PBMCs versus normal memory cells. qRT-PCR was performed to evaluated mRNA expression of 14 up-regulated genes in activated and resting memory versus naïve cells in resting and activated SS PBMCs versus normal memory cells. The temporal expressions of nine out of 14 genes that were up-regulated at both two and six hours and six hours only in normal memory cells compared to SS PBMCs at statistically significant differences (p<0.05) were displayed as linear graphs. In addition, CCR6 was up-regulated at all time points of stimulation in normal memory cells compared to SS PBMCs (p<0.05). Error bars represented standard error of the mean. p-values were also calculated for each time point (*: p<0.05, **: p<0.005).
Fig. 8
Fig. 8
Summary of confirmatory testing of genes differentially regulated in naïve and memory T cells and comparison of these genes in SS PBMCs versus memory T cells. NET1 was up-regulated in resting naïve versus resting memory cells, two out of four genes increased in expression in resting memory versus naïve cells, and 14 out of 18 genes were up-regulated in memory versus naïve cells activated for two and six hours with PMA/A23187. Compared to normal memory cells, activated SS PBMCs showed down-regulation of nine out of 14 genes up-regulated in activated memory versus naïve cells, and resting SS PBMCs had decreased expression in CCR6, which was found to be up-regulated in resting memory versus naïve cells.

Similar articles

Cited by

References

    1. Luqman M, Bottomly K. Activation requirements for CD4+ T cells differing in CD45R expression. J Immunol. 1992;149:2300–6. - PubMed
    1. Tanchot C, Lemonnier FA, Perarnau B, Freitas AA, Rocha B. Differential requirements for survival and proliferation of CD8 naive or memory T cells. Science. 1997;276:2057–62. - PubMed
    1. London CA, Lodge MP, Abbas AK. Functional responses and costimulator dependence of memory CD4+ T cells. J Immunol. 2000;164:265–72. - PubMed
    1. Croft M, Bradley LM, Swain SL. Naive versus memory CD4 T cell response to antigen. Memory cells are less dependent on accessory cell costimulation and can respond to many antigen-presenting cell types including resting B cells. J Immunol. 1994;152:2675–85. - PubMed
    1. Van de Velde H, Lorre K, Bakkus M, Thielemans K, Ceuppens JL, de Boer M. CD45RO+ memory T cells but not CD45RA+ naive T cells can be efficiently activated by remote co-stimulation with B7. Int Immunol. 1993;5:1483–7. - PubMed

Publication types

Substances