

Sequence signatures and mRNA concentration can explain two-thirds of protein abundance variation in a human cell line
- PMID: 20739923
- PMCID: PMC2947365
- DOI: 10.1038/msb.2010.59
Sequence signatures and mRNA concentration can explain two-thirds of protein abundance variation in a human cell line
Abstract
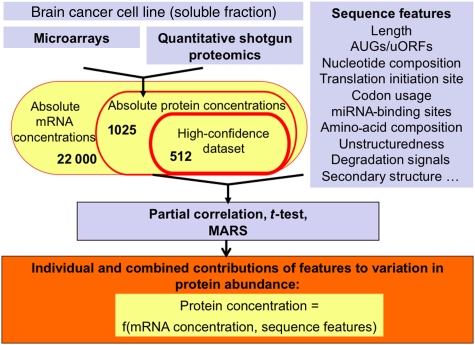
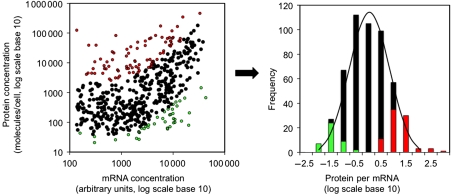
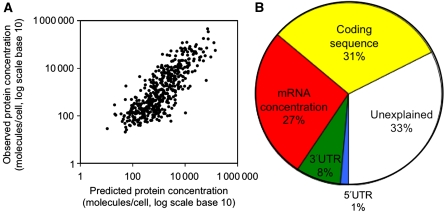
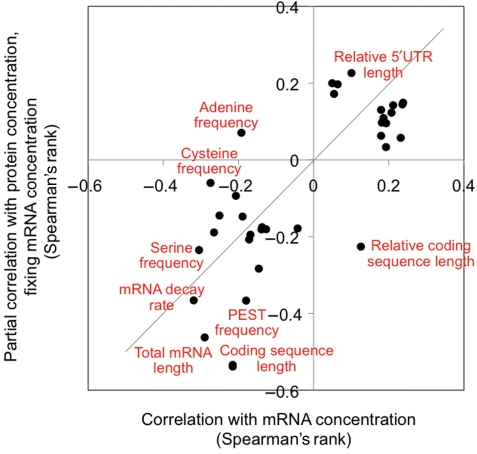
Transcription, mRNA decay, translation and protein degradation are essential processes during eukaryotic gene expression, but their relative global contributions to steady-state protein concentrations in multi-cellular eukaryotes are largely unknown. Using measurements of absolute protein and mRNA abundances in cellular lysate from the human Daoy medulloblastoma cell line, we quantitatively evaluate the impact of mRNA concentration and sequence features implicated in translation and protein degradation on protein expression. Sequence features related to translation and protein degradation have an impact similar to that of mRNA abundance, and their combined contribution explains two-thirds of protein abundance variation. mRNA sequence lengths, amino-acid properties, upstream open reading frames and secondary structures in the 5' untranslated region (UTR) were the strongest individual correlates of protein concentrations. In a combined model, characteristics of the coding region and the 3'UTR explained a larger proportion of protein abundance variation than characteristics of the 5'UTR. The absolute protein and mRNA concentration measurements for >1000 human genes described here represent one of the largest datasets currently available, and reveal both general trends and specific examples of post-transcriptional regulation.
Conflict of interest statement
The authors declare that they have no conflict of interest.
Figures
Similar articles
-
Translational control of apolipoprotein B mRNA: regulation via cis elements in the 5' and 3' untranslated regions.Biochemistry. 2004 Jun 1;43(21):6734-44. doi: 10.1021/bi049887s. Biochemistry. 2004. PMID: 15157107
-
Cytochrome P450 1B1 mRNA untranslated regions interact to inhibit protein translation.Mol Carcinog. 2010 Feb;49(2):190-9. doi: 10.1002/mc.20589. Mol Carcinog. 2010. PMID: 19908239
-
Migration of Small Ribosomal Subunits on the 5' Untranslated Regions of Capped Messenger RNA.Int J Mol Sci. 2019 Sep 10;20(18):4464. doi: 10.3390/ijms20184464. Int J Mol Sci. 2019. PMID: 31510048 Free PMC article.
-
Insights into the regulation of protein abundance from proteomic and transcriptomic analyses.Nat Rev Genet. 2012 Mar 13;13(4):227-32. doi: 10.1038/nrg3185. Nat Rev Genet. 2012. PMID: 22411467 Free PMC article. Review.
-
Regulation of tumor suppressor p53 at the RNA level.J Mol Med (Berl). 2010 Jul;88(7):645-52. doi: 10.1007/s00109-010-0609-2. Epub 2010 Mar 21. J Mol Med (Berl). 2010. PMID: 20306257 Review.
Cited by
-
The proteomic response to mutants of the Escherichia coli RNA degradosome.Mol Biosyst. 2013 Apr 5;9(4):750-7. doi: 10.1039/c3mb25513a. Mol Biosyst. 2013. PMID: 23403814 Free PMC article.
-
Genomic meta-analysis of growth factor and integrin pathways in chronic kidney transplant injury.BMC Genomics. 2013 Apr 23;14:275. doi: 10.1186/1471-2164-14-275. BMC Genomics. 2013. PMID: 23617750 Free PMC article.
-
Transcriptomic analyses of genes and tissues in inherited sensory neuropathies.Exp Neurol. 2016 Sep;283(Pt A):375-395. doi: 10.1016/j.expneurol.2016.06.023. Epub 2016 Jun 23. Exp Neurol. 2016. PMID: 27343803 Free PMC article.
-
The human volatilome meets cancer diagnostics: past, present, and future of noninvasive applications.Metabolomics. 2024 Oct 7;20(5):113. doi: 10.1007/s11306-024-02180-5. Metabolomics. 2024. PMID: 39375265 Review.
-
Phenotypic impact of genomic structural variation: insights from and for human disease.Nat Rev Genet. 2013 Feb;14(2):125-38. doi: 10.1038/nrg3373. Nat Rev Genet. 2013. PMID: 23329113 Review.
References
Publication types
MeSH terms
Substances
Grants and funding
LinkOut - more resources
Full Text Sources
Other Literature Sources
