Comparative Study
. 2010 Dec;78(11):1136-53.
doi: 10.1038/ki.2010.287. Epub 2010 Aug 25.

Angiotensin II overcomes strain-dependent resistance of rapid CKD progression in a new remnant kidney mouse model

Affiliations
Comparative Study

Angiotensin II overcomes strain-dependent resistance of rapid CKD progression in a new remnant kidney mouse model

Asada Leelahavanichkul et al. Kidney Int. 2010 Dec.

Abstract

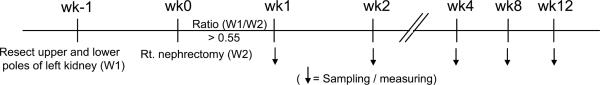
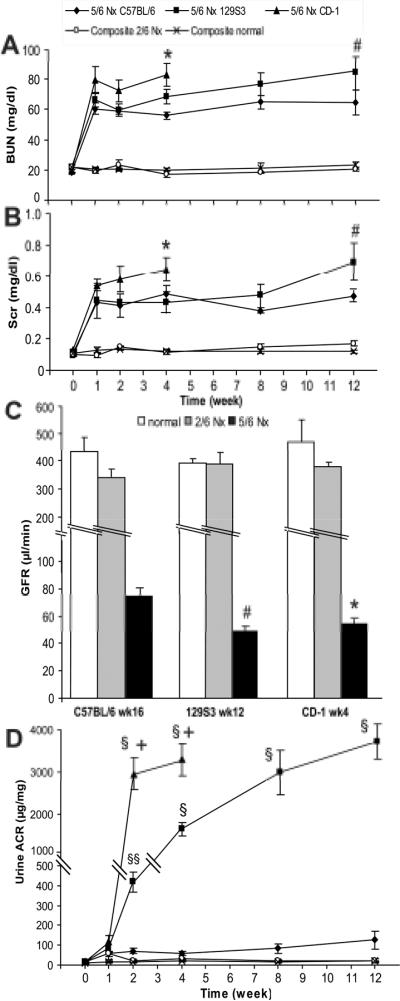
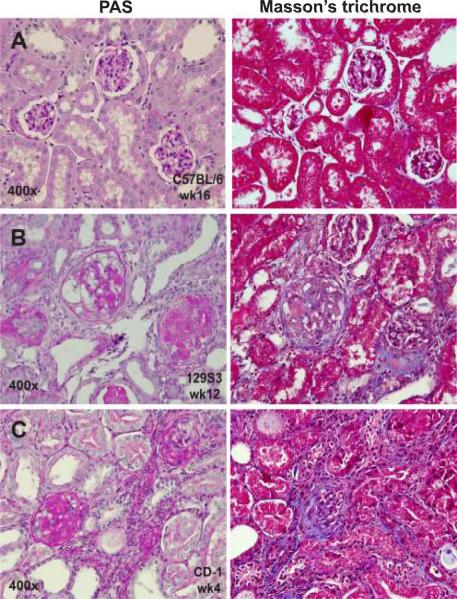
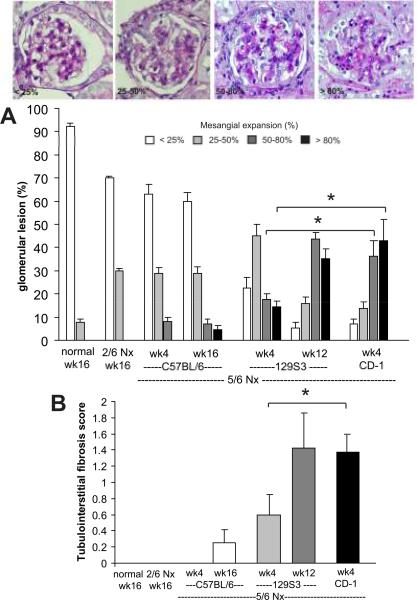
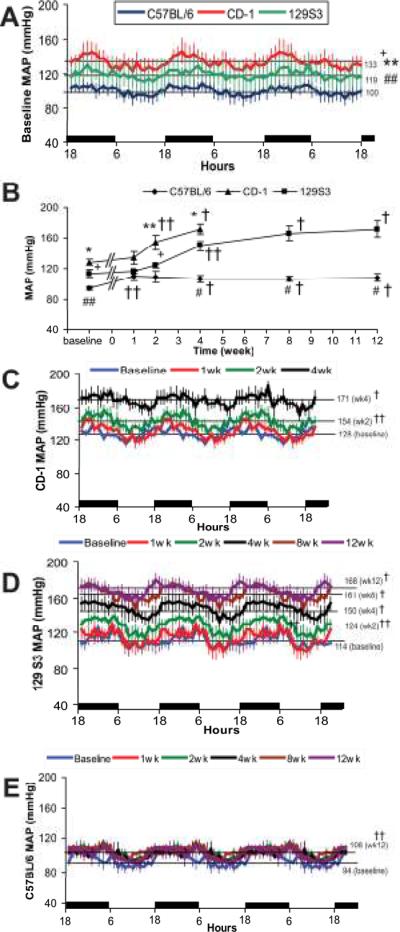
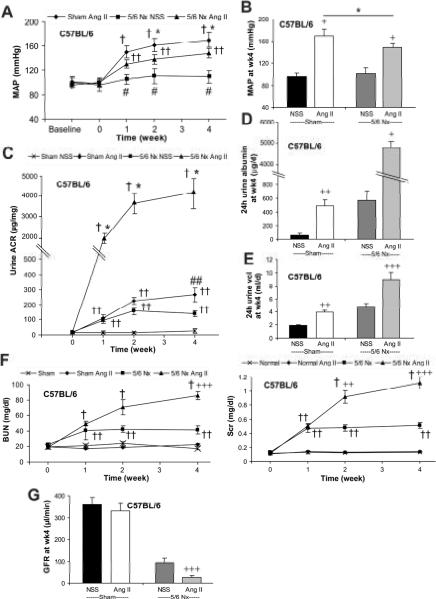
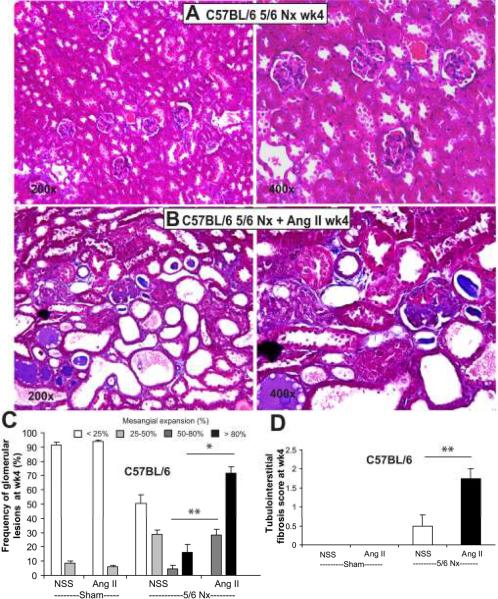
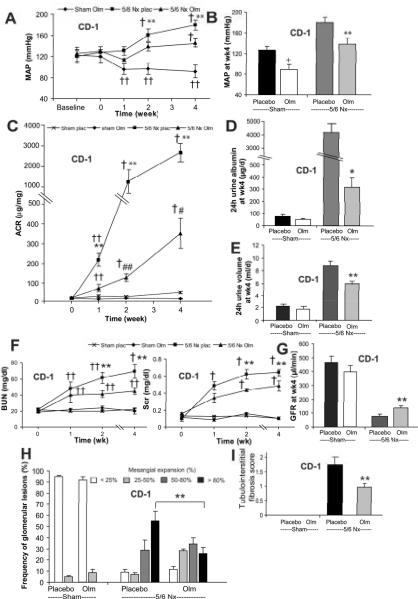
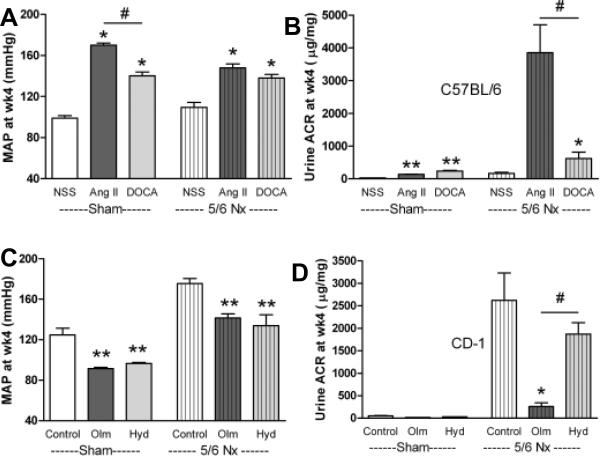
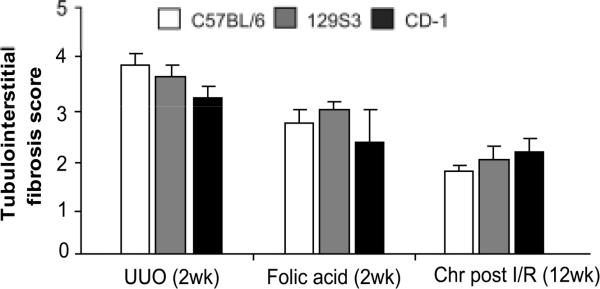
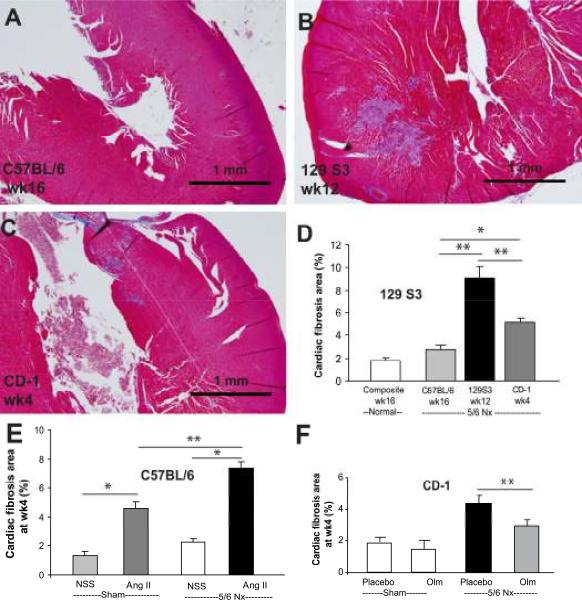
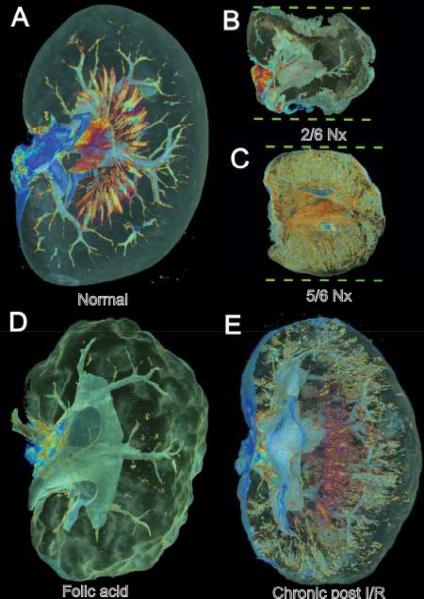
The remnant kidney model in C57BL/6 mice does not develop progressive chronic kidney disease (CKD). In this study we modified the model to mimic features of human CKD and to define accelerants of disease progression using three strains of mice. Following the procedure, there was a progressive increase in albuminuria, progressive loss in renal function, severe glomerulosclerosis and interstitial fibrosis, hypertension, cardiac fibrosis, and anemia by 4 weeks in CD-1 mice and by 12 weeks in 129S3 mice. In contrast, even after 16 weeks, the C57BL/6 mice with a remnant kidney had modestly increased albuminuria without increased blood pressure and without developing CKD or cardiac fibrosis. The baseline blood pressure, determined by radiotelemetry in conscious animals, correlated with CKD progression rates in each strain. Administering angiotensin II overcame the resistance of C57BL/6 mice to CKD following renal mass reduction, displaying high blood pressure and albuminuria, severe glomerulosclerosis, and loss of renal function by 4 weeks. Decreasing blood pressure with olmesartan, but not hydralazine, in CD-1 mice with a remnant kidney reduced CKD progression and cardiac fibrosis. C57BL/6 mice with a remnant kidney and DOCA-salt hypertension developed modest CKD. Each strain had similar degrees of interstitial fibrosis in three different normotensive models of renal fibrosis. Thus, reducing renal mass in CD-1 or 129S3 mice mimics many features of human CKD. Angiotensin II can convert the C57BL/6 strain from CKD resistant to susceptible in this disease model.


Figures

Figure 1
Figure 1. Two stage reduction in renal mass model (5/6 nephrectomy)
Schema of mouse 5/6 nephrectomy protocol. Animals were studied if the ratio of resected left kidney/ removed right kidney (W1/W2; see Methods) was 0.55–0.72.
Figure 2
Figure 2. Strain-specific temporal changes in kidney function and albuminuria following reduction of renal mass
Time course of renal function as determined by BUN (A) or serum creatinine (B) and albuminuria as determined by spot urine albumin/creatinine ratio (ACR) (D) in composite normal control (n=6), composite 2/6 Nx control (n=6), 5/6 Nx in C57BL/6 (n=5–9), 129S3 (n=5–11) and CD-1 (n=5–12) strains. The GFR (C) of C57BL/6, 129S3 at wk10 and CD-1 at wk4 with normal sham surgery control, 2/6 Nx control and 5/6 Nx (n=4/group). *, P<0.05 5/6 Nx in CD-1 vs C57BL/6; #, P<0.05 5/6 Nx in 129S3 vs C57BL/6; +, P<0.005 5/6 Nx in CD-1 vs 129S3 in the same time point; §, P<0.001 urine ACR at specific time point vs wk0; §§, P<0.05 urine ACR at specific time point vs wk0
Figure 3
Figure 3. Strain-specific changes in glomerular injury following reduction in renal mass
Representative images of sections stained by periodic acid-Schiff (left panels) and Masson's trichrome (right panels) after 5/6 Nx in CD-1 at wk4 (A), 129S3 at wk12 (B) and C57BL/6 at wk16 (C) (original magnification 400×).
Figure 4
Figure 4. Strain-specific changes in glomerular injury and tubulointerstitial fibrosis following reduction in renal mass
Semi-quantitative measures of glomerular injury assessed by mesangial expansion in periodic acid-Schiff stain (upper panel 400× original magnification) and tubulointerstitial fibrosis score from Masson's trichrome stain of composite normal control at wk16 (n=5), composite 2/6 Nx at wk16 (n=5), 5/6 Nx in C57BL/6 at wk4 (n=4), wk16 (n=8), 5/6 Nx in 129S3 at wk4 (n=5), wk12 (n=7) and 5/6 Nx in CD-1 at wk4 (n=10). See Methods section for details. *, P<0.05 5/6 Nx in CD-1 wk4 vs 129S3 wk4
Figure 5
Figure 5. Strain-specific changes in diurnal and temporal mean arterial pressure (MAP) by telemetry after reduction in renal mass
Systemic blood pressure measured by telemetry. Diurnal changes in baseline (A) mean arterial pressure (MAP; n = 11–13/group), temporal changes in MAP following 5/6 Nx (B; n = 4–5/group), and diurnal changes in MAP following 5/6 Nx in C57BL/6, 129S3, and CD-1 mice (n = 4–5/group) (C–E). Black bars = night time. ; * P<0.001 CD-1 vs C57BL/6**, P<0.05 CD-1 vs C57BL/6; # P<0.005 129S3 vs C57BL/6; ##, P<0.05 129S3 vs C57BL/6; +, P<0.05 CD-1 vs 129S3; †, P< 0.001 MAP at specific time point vs baseline; ††, P<0.05 MAP at specific time point vs baseline MAP of CD-1 5/6 nephrectomy at wk1, 2, 4 were 134±8, 154±9, 171±7 mmHg; MAP of 129S3 5/6 Nx at wk1, 2, 4, 8, 12 were 117±3, 124±3, 150±6, 161±10, 168±11 mmHg; MAP of C57BL/6 at wk1, 2, 4, 8, 12 were 110±6, 109±7, 107±4, 107±4, 108±5 mmHg respectively (Fig 6B). By Repeated Measures ANOVA blood pressure change over time at weeks 1, 2 and 4, within-subject effect (Time) is significant (p<0.0001) and interaction between Time and Strain is significant (p=0.0008). Therefore, the between strain differences in mean blood pressure were expanding from week 1 to week 4.
Figure 6
Figure 6. Effect of Angiotensin II administration on renal hemodynamics, function, and injury in C57BL/6 after reduction in renal mass
MAP change of C57BL/6 mice following 5/6 Nx (5/6 Nx) or sham surgery controls (sham) with Angiotensin II (Ang II) administration or normal saline (NSS) control (A). Effect of Angiotensin II or NSS control on MAP at wk4 (B), increase in spot urine albumin/creatinine ratio (ACR) (C), 24h urine albumin at wk4 (D), 24h urine volume at wk4 (E), progression in BUN, Scr (F), GFR at wk4 (G) in C57BL/6 mice subjected to 5/6 Nx vs. sham surgery control treated with NSS or Angiotensin II; (n=4–6/group). *,P<0.005 5/6 Nx + Ang II vs sham + Ang II; **, P<0.05 5/6 Nx + Ang II vs sham + Ang II, #, P<0.001 5/6 Nx + NSS vs sham + Ang II, ##, P<0.05 5/6 Nx + NSS vs sham + Ang II; +, P<0.001 Ang II vs NSS; ++, P<0.005 Ang II vs NSS; +++, P<0.05 Ang II vs NSS; †, P< 0.001 value at specific time point vs baseline; ††, P< 0.05 value at specific time point vs baseline
Figure 7
Figure 7. Effect of 4 wk Angiotensin II administration on glomerulosclerosis, tubulointerstitial and cardiac change in C57BL/6 after reduction in renal mass
Typical images of glomerular injury after Masson's trichrome stain in C57BL/6 5/6 Nx (A) and C57BL/6 5/6 Nx + Ang II (B) (original magnification: 200×, left panels and 400×, right panels) and semi-qualitative measurement of glomerular mesangial expansion after periodic acid-Schiff staining (C), tubulointerstitial fibrosis score from Masson's trichrome stain (D) from sham surgery control (sham) treated with normal saline (NSS) or Angiotensin II (Ang II) and 5/6 Nx treated with NSS or Ang II (n = 4/group). *, P<0.005 Ang II vs NSS, ** P<0.05 Ang II vs NSS
Figure 8
Figure 8. Effect of olmesartan treatment on blood pressure, renal function, and injury in CD-1 mice after reduction in renal mass
MAP change of CD-1 mice following 5/6 Nx or sham surgery controls (sham) with Olmesartan treatment or placebo control (A). The response to Olmesartan of the sham surgery (control) and 2/6 Nx sham surgery was not different so the data was combined (sham Olm). Effect of Olmesartan or placebo control on MAP at wk4 (B), increase in spot urine albumin/creatinine ratio (ACR) (C), 24h urine albumin at wk4 (D), 24h urine volume at wk4 (E), progression of BUN, Scr (F), GFR at wk4 (G), and semiquantitative scoring of kidney at wk4 (H, I) subjected to 5/6 Nx or sham surgery control with Olmesartan or placebo; (n=4–6/group). *,P<0.005 5/6 Nx + Olmesartan vs 5/6 Nx + placebo; **, P<0.05 5/6 Nx + Olmesartan vs 5/6 Nx + placebo, #, P<0.005 5/6 Nx + Olmesartan vs sham + Olmesartan, ##, P<0.05 5/6 Nx + Olmesartan vs sham with Olm;+, P<0.05 sham + Olmesartan vs sham + placebo; †, P< 0.001 value at specific time point vs baseline; ††, P< 0.05 value at specific time point vs baseline
Figure 9
Figure 9. MAP and albuminuria after DOCA-salt administration/reduction of renal mass in C57BL/6 mice or after hydralazine treatment/reduction of renal mass in CD-1 mice
MAP (A) and albuminuria (B) 4wk after 5/6 Nx (5/6 Nx) or sham surgery controls (sham) in C57BL/6 mice followed by angiotensin II (Ang II) or DOCA-salt (normal saline substituted for drinking water) administration or normal saline (NSS) control. MAP (C) and albuminuria (D) 4wk after 5/6 Nx or sham surgery controls (sham) in CD-1 mice followed by olmesartan (Olm) or hydralazine (Hyd) treatment or control. *, P<0.005 drug administration vs control in each group; **, P<0.05 drug administration vs control in each group; #, P<0.005
Figure 10
Figure 10. Lack of strain-selective differences in tubulointerstitial fibrosis after unilateral ureteral obstruction, folic acid, and chronic ischemia/reperfusion injury
The tubulointerstitial fibrosis scores in mice subjected to unilateral ureteral obstruction (UUO) after 2 wk, folic acid injection after 2 wk, and chronic I/R after 12 wk in C57BL/6, 129S3, and CD-1 mice (n=4/group).
Figure 11
Figure 11. Strain-specific temporal changes in body weight, anemia, erythropoietin, and serum phosphate following reduction in renal mass
Temporal changes in body weight (A), hematocrit (Hct: B), and serum erythropoietin (EPO: C). Number of animals for body weight: {[CD-1 with normal sham surgery control (n=7), 2/6 Nx control (n=4) and 5/6 Nx (n=12)], [129S3 and C57BL/6 with normal sham surgery control (n=5), 2/6 Nx control (n=8), 129S3 5/6 Nx (n=12) and C57BL/6 5/6 Nx (n=9)]}, hematocrit (Hct) and plasma erythropoietin: [composite normal sham surgery control (n=6), 2/6 Nx control (n=6), CD-1 5/6Nx (n=12), 129 Sv 5/6 Nx (n=12), C57BL/6 5/6 Nx (n=9)], serum phosphate (D) and amylase (E): [composite normal sham surgery control at wk16 (n=6), composite 2/6 Nx control at wk16 (n=6), C57BL/6 5/6 Nx at wk16 (n=4), 129S3 5/6 Nx at wk12 (n=4) and CD-1 5/6 Nx at wk4 (n=4)]. *, P<0.001 CD-1 5/6 Nx vs 2/6 Nx; †, P<0.005 5/6 Nx at specific time point vs wk0; ††, P<0.05 5/6 Nx at specific time point vs wk0; #, P<0.001 5/6 Nx in 129S3 vs composite 2/6 Nx; ##, P<0.005 5/6 Nx in C57BL/6 vs composite 2/6 Nx; +, P<0.001 5/6 Nx vs composite 2/6 Nx; ++, P<0.001 composite 2/6 Nx vs normal; +++, P<0.05 composite 2/6 Nx vs normal; §, P<0.05 5/6 Nx vs composite 2/6 Nx; §§, P<0.001 5/6 Nx vs composite 2/6 Nx.
Figure 12
Figure 12. Strain-specific changes in cardiac fibrosis after reduction in renal mass and changes in cardiac fibrosis after angiotensin II (in C57BL/6 resistance strain) or olmesartan (in CD-1 susceptible strain) administration
Typical images of Masson's trichrome stained cardiac sections after 5/6 Nx in C57BL/6 at wk16 (A), 129S3 at wk12 (B), and CD-1 at wk4 (C) (original magnification 20×). The percentage of fibrotic area was more severe in 129S3 5/6 Nx at 12 wk compared with 5/6 Nx in other strains (D) (n=4/group). Angiotensin II administration in either sham normal kidney or 5/6 Nx in C57BL/6 (resistant strain) mice caused mild and severe cardiac fibrosis respectively (E) (n=4/group), Olmesartan treatment in CD-1 5/6 Nx attenuated cardiac fibrosis (F) (n=4–6/group). *, P<0.05, **, P<0.001.
Figure 13
Figure 13. Three-dimensional rendering of mouse kidney acquired through microCT based Virtual Histology™ from normal, 5/6 Nx, folic acid injection and chronic post-I/R
Renderings from serial microCT sections from CD-1 mice in sham normal kidney at 4 wk (A), left kidney after 2/6 Nx control at 4 wk (B), left kidney after 5/6 Nx at 4 wk (C), folic acid injection after 2 wk (D) and chronic post I/R at 12 wk. Digital sagittal sections of the 3-dimensional image from sham normal kidney showed smooth surface and clear cortical area (A), 2/6 Nx control demonstrated mild irregular surface but clear cortical area (B), in contrast, dense opaque yellow color was found in 5/6 Nx model (C) reciprocal with very high proteinuria. The severe irregular surface with clear cortical area in folic acid model (D) correlated with severe interstitial fibrosis without albuminuria in this model. Moderately dense yellow color in cortical area of chronic post I/R (E) corresponded with moderate albuminuria.

Similar articles

Cited by

References

    1. K/DOQI clinical practice guidelines for chronic kidney disease: evaluation, classification, and stratification. Am J Kidney Dis. 2002;39:S1–266. - PubMed
    1. Patel SS, Kimmel PL, Singh A. New clinical practice guidelines for chronic kidney disease: a framework for K/DOQI. Semin Nephrol. 2002;22:449–458. - PubMed
    1. Hossain MP, Goyder EC, Rigby JE, et al. CKD and poverty: a growing global challenge. Am J Kidney Dis. 2009;53:166–174. - PubMed
    1. Coresh J, Astor BC, Greene T, et al. Prevalence of chronic kidney disease and decreased kidney function in the adult US population: Third National Health and Nutrition Examination Survey. Am J Kidney Dis. 2003;41:1–12. - PubMed
    1. Mitka M. Report notes increase in kidney disease. JAMA. 2008;300:2473–2474. - PubMed

Publication types

MeSH terms