

Analysis of CD14 expression levels in putative mesenchymal progenitor cells isolated from equine bone marrow
- PMID: 20722500
- PMCID: PMC3128771
- DOI: 10.1089/scd.2010.0175
Analysis of CD14 expression levels in putative mesenchymal progenitor cells isolated from equine bone marrow
Abstract
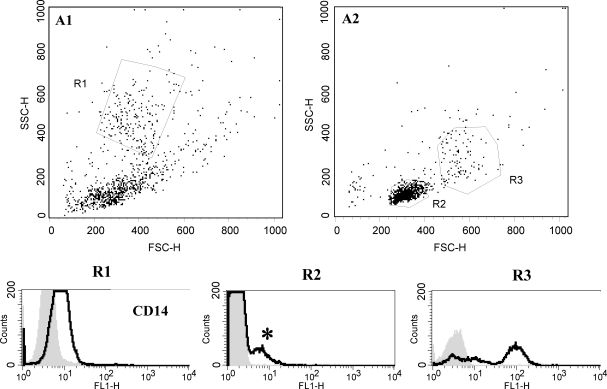
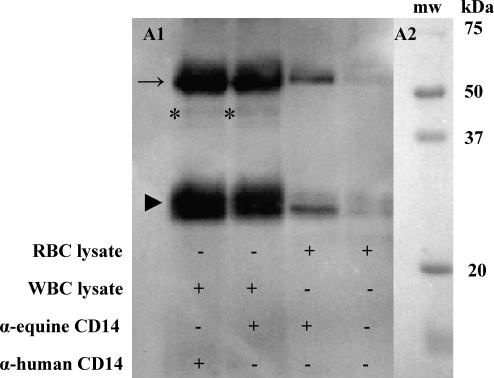
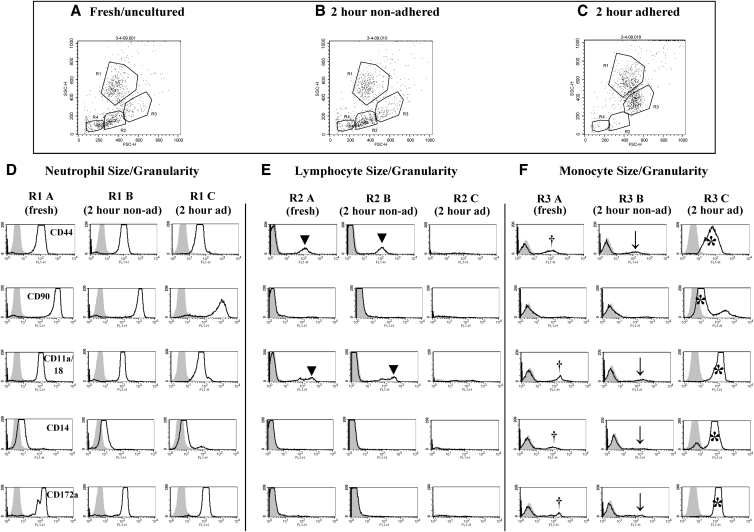
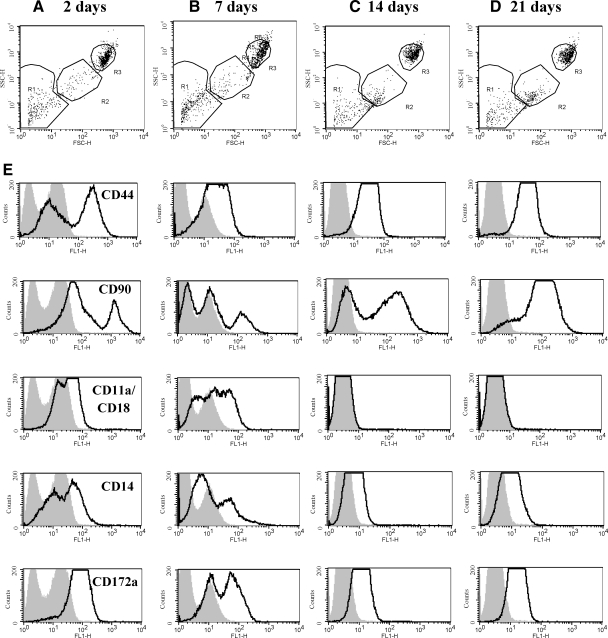
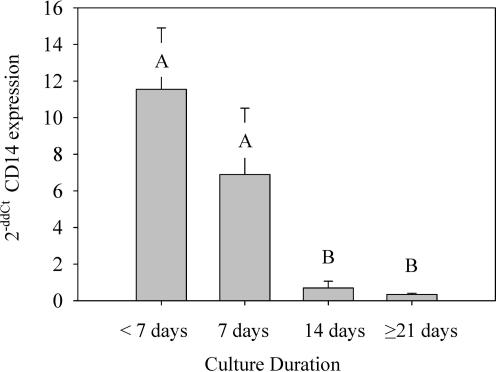
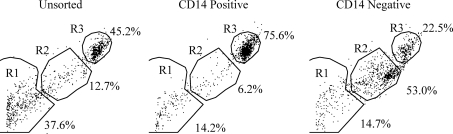
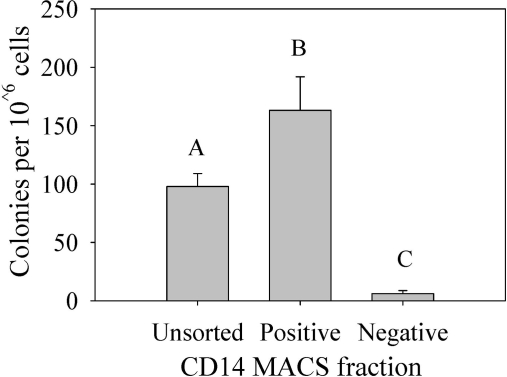
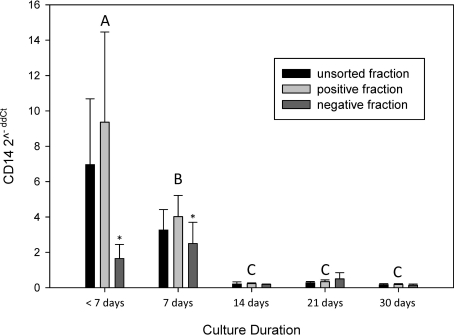
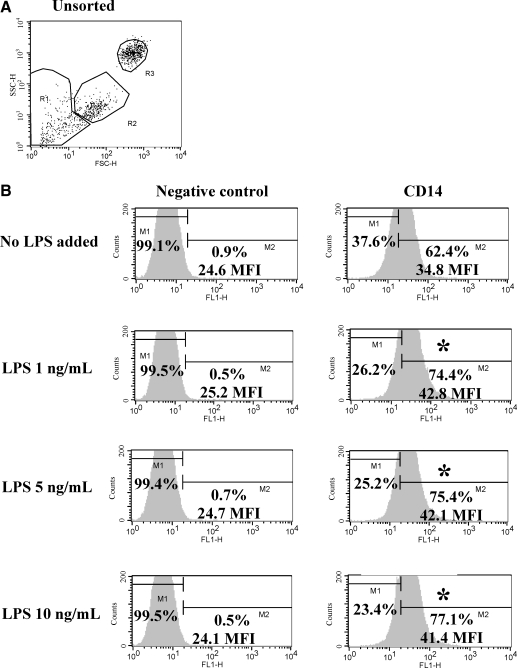
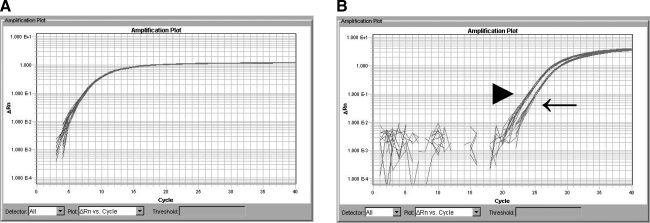
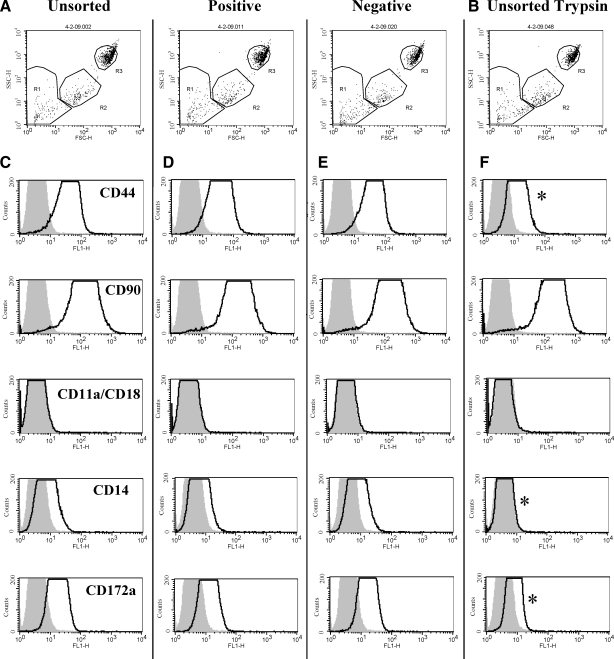
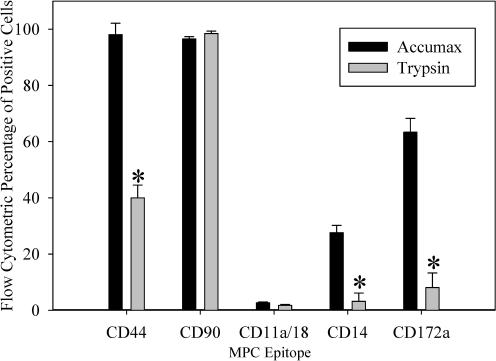
A long-term goal of mesenchymal progenitor cell (MPC) research is to identify cell-surface markers to facilitate MPC isolation. One reported MPC feature in humans and other species is lack of CD14 (lipopolysaccharide receptor) expression. The aim of this study was to evaluate CD14 as an MPC sorting marker. Our hypothesis was that cells negatively selected by CD14 expression would enrich MPC colony formation compared with unsorted and CD14-positive fractions. After validation of reagents, bone marrow aspirate was obtained from 12 horses. Fresh and cultured cells were analyzed by flow cytometry and reverse transcription and quantitative polymerase chain reaction to assess dynamic changes in phenotype. In fresh samples, cells did not consistently express protein markers used for lineage classification. Short-term (2-day) culture allowed distinction between hematopoietic and nonhematopoietic populations. Magnetic activated cell sorting was performed on cells from 6 horses to separate adherent CD14(+) from CD14(-) cells. MPC colony formation was assessed at 7 days. Cells positively selected for CD14 expression were significantly more likely to form MPC colonies than both unsorted and negatively selected cells (P ≤ 0.005). MPCs from all fractions maintained low levels of CD14 expression long term, and upregulated CD14 gene and protein expression when stimulated with lipopolysaccharide. The equine CD14 molecule was trypsin-labile, offering a plausible explanation for the discrepancy with MPC phenotypes reported in other species. By definition, MPCs are considered nonhematopoietic because they lack expression of molecules such as CD14. Our results challenge this assumption, as equine MPCs appear to represent a descendant of a CD14-positive cell.
Figures
Similar articles
-
Temporal analysis of equine bone marrow aspirate during establishment of putative mesenchymal progenitor cell populations.Stem Cells Dev. 2010 Feb;19(2):269-82. doi: 10.1089/scd.2009.0091. Stem Cells Dev. 2010. PMID: 19604071 Free PMC article.
-
Human palatine tonsil: a new potential tissue source of multipotent mesenchymal progenitor cells.Arthritis Res Ther. 2008;10(4):R83. doi: 10.1186/ar2459. Epub 2008 Jul 28. Arthritis Res Ther. 2008. PMID: 18662393 Free PMC article.
-
Isolation and characterization of bone marrow multipotential mesenchymal progenitor cells.Arthritis Rheum. 2002 Dec;46(12):3349-60. doi: 10.1002/art.10696. Arthritis Rheum. 2002. PMID: 12483742
-
Prospective identification and isolation of murine bone marrow derived multipotent mesenchymal progenitor cells.Best Pract Res Clin Haematol. 2011 Mar;24(1):13-24. doi: 10.1016/j.beha.2010.11.003. Epub 2011 Jan 14. Best Pract Res Clin Haematol. 2011. PMID: 21396589 Review.
-
Phenotypic and functional heterogeneity of human bone marrow- and amnion-derived MSC subsets.Ann N Y Acad Sci. 2012 Aug;1266:94-106. doi: 10.1111/j.1749-6632.2012.06551.x. Ann N Y Acad Sci. 2012. PMID: 22901261 Review.
Cited by
-
Scalable Production of Equine Platelet Lysate for Multipotent Mesenchymal Stromal Cell Culture.Front Bioeng Biotechnol. 2021 Jan 21;8:613621. doi: 10.3389/fbioe.2020.613621. eCollection 2020. Front Bioeng Biotechnol. 2021. PMID: 33553119 Free PMC article.
-
CD14 is a unique membrane marker of porcine spermatogonial stem cells, regulating their differentiation.Sci Rep. 2019 Jul 10;9(1):9980. doi: 10.1038/s41598-019-46000-6. Sci Rep. 2019. PMID: 31292454 Free PMC article.
-
Chondrogenic Differentiation of Defined Equine Mesenchymal Stem Cells Derived from Umbilical Cord Blood for Use in Cartilage Repair Therapy.Int J Mol Sci. 2018 Feb 10;19(2):537. doi: 10.3390/ijms19020537. Int J Mol Sci. 2018. PMID: 29439436 Free PMC article.
-
Isolation and characterization of human gingiva-derived mesenchymal stem cells using limiting dilution method.J Dent Sci. 2016 Sep;11(3):304-314. doi: 10.1016/j.jds.2016.03.010. Epub 2016 May 6. J Dent Sci. 2016. PMID: 30894989 Free PMC article.
-
Comparison of Antibacterial and Immunological Properties of Mesenchymal Stem/Stromal Cells from Equine Bone Marrow, Endometrium, and Adipose Tissue.Stem Cells Dev. 2018 Nov 1;27(21):1518-1525. doi: 10.1089/scd.2017.0241. Epub 2018 Sep 6. Stem Cells Dev. 2018. PMID: 30044182 Free PMC article.
References
-
- Dominici M. Le Blanc K. Mueller I. Slaper-Cortenbach I. Marini F. Krause D. Deans R. Keating A. Prockop D. Horwitz E. Minimal criteria for defining multipotent mesenchymal stromal cells. The International Society for Cellular Therapy position statement. Cytotherapy. 2006;8:315–317. - PubMed
-
- Kuwana M. Okazaki Y. Kodama H. Izumi K. Yasuoka H. Ogawa Y. Kawakami Y. Ikeda Y. Human circulating CD14+ monocytes as a source of progenitors that exhibit mesenchymal cell differentiation. J Leukoc Biol. 2003;74:833–845. - PubMed
-
- Kodama H. Inoue T. Watanabe R. Yasuoka H. Kawakami Y. Ogawa S. Ikeda Y. Mikoshiba K. Kuwana M. Cardiomyogenic potential of mesenchymal progenitors derived from human circulating CD14+ monocytes. Stem Cells Dev. 2005;14:676–686. - PubMed
-
- Pufe T. Petersen W. Fandrich F. Varoga D. Wruck CJ. Mentlein R. Helfenstein A. Hoseas D. Dressel S. Tillmann B. Ruhnke M. Programmable cells of monocytic origin (PCMO): a source of peripheral blood stem cells that generate collagen type II-producing chondrocytes. J Orthop Res. 2008;26:304–313. - PubMed
Publication types
MeSH terms
Substances
Grants and funding
LinkOut - more resources
Full Text Sources
Research Materials
