. 2010 Aug 18;30(33):11073-85.
doi: 10.1523/JNEUROSCI.0983-10.2010.

The postsynaptic adenomatous polyposis coli (APC) multiprotein complex is required for localizing neuroligin and neurexin to neuronal nicotinic synapses in vivo

Affiliations

The postsynaptic adenomatous polyposis coli (APC) multiprotein complex is required for localizing neuroligin and neurexin to neuronal nicotinic synapses in vivo

Madelaine M Rosenberg et al. J Neurosci. .

Abstract

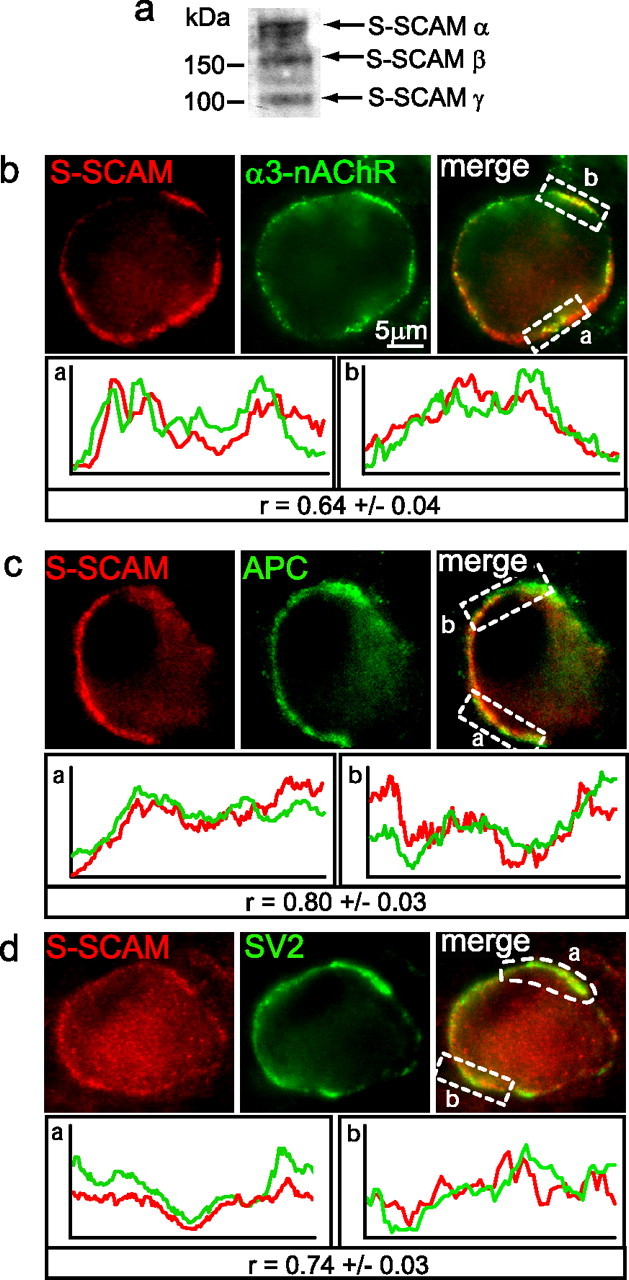
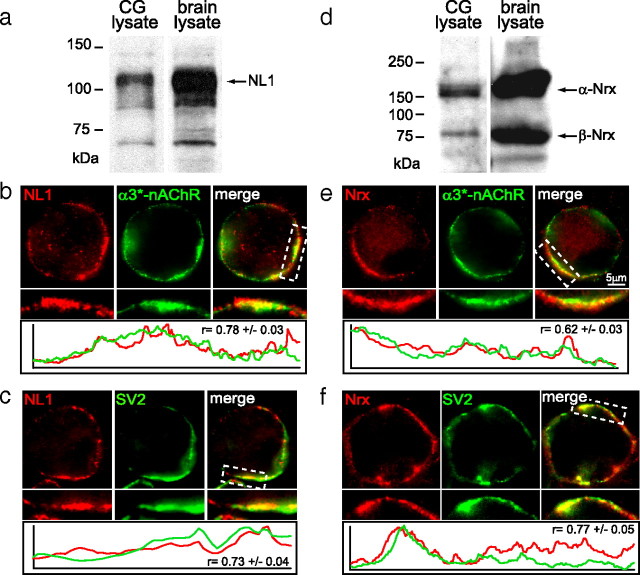
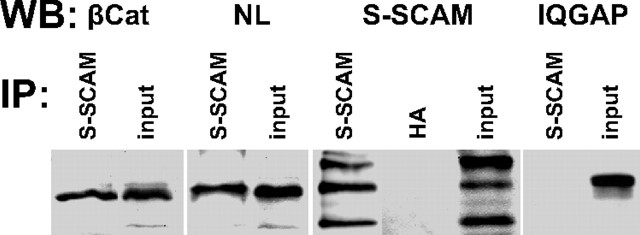
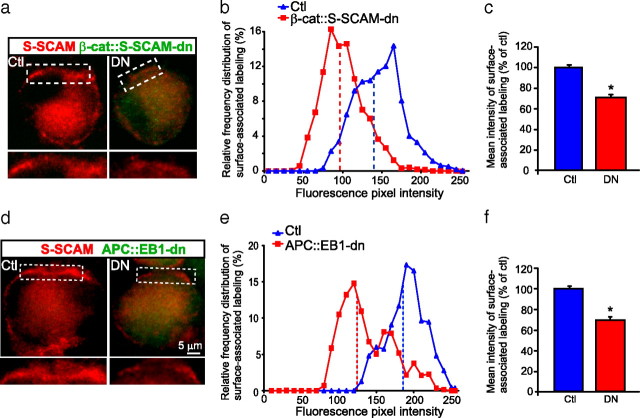
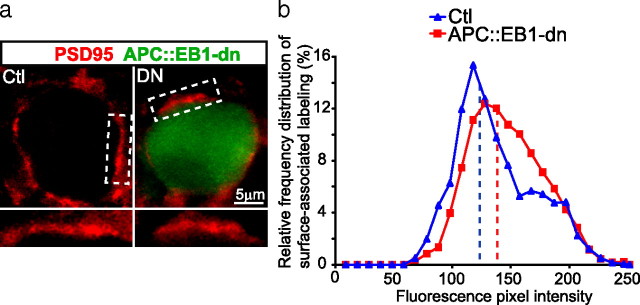
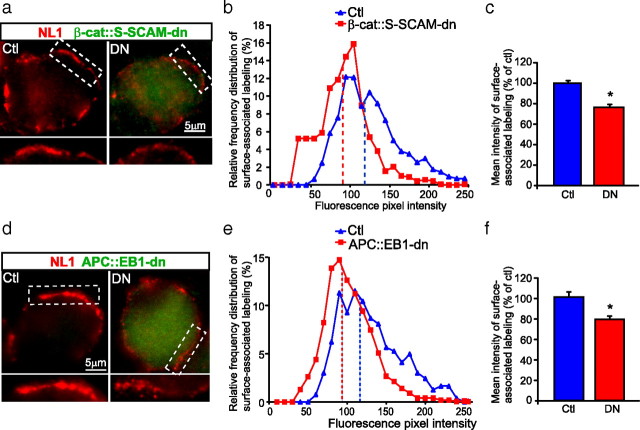
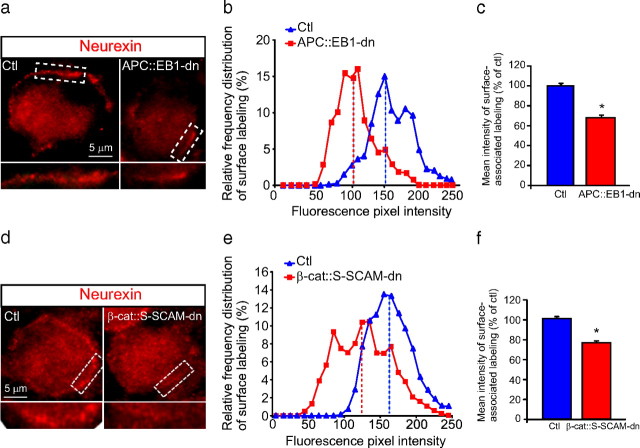
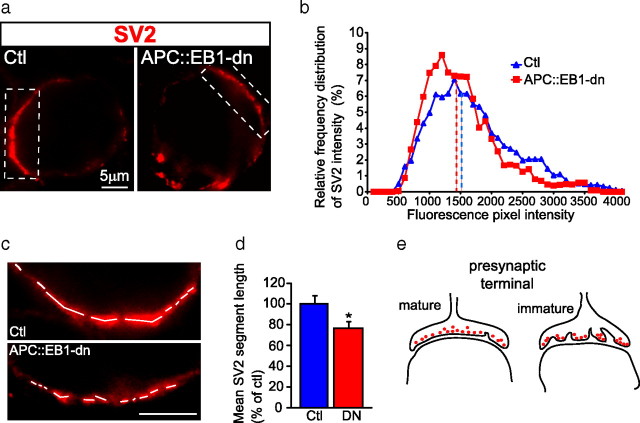
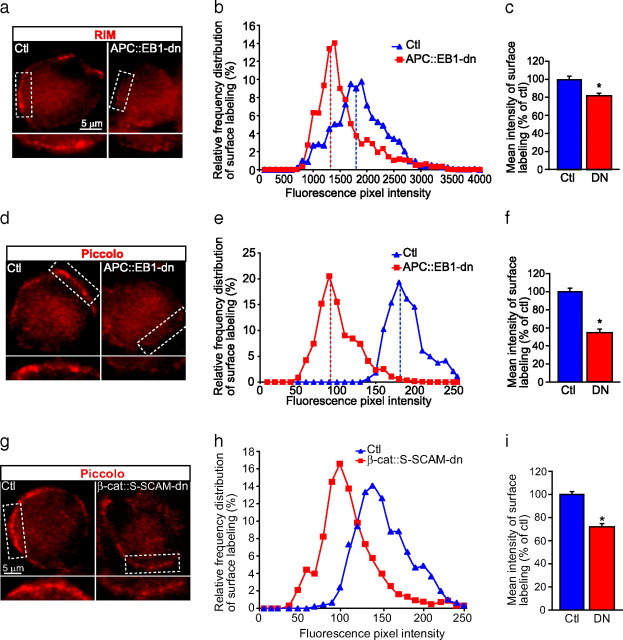
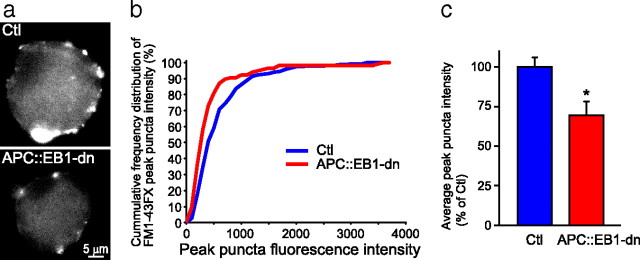
Synaptic efficacy requires that presynaptic and postsynaptic specializations align precisely and mature coordinately. The underlying mechanisms are poorly understood, however. We propose that adenomatous polyposis coli protein (APC) is a key coordinator of presynaptic and postsynaptic maturation. APC organizes a multiprotein complex that directs nicotinic acetylcholine receptor (nAChR) localization at postsynaptic sites in avian ciliary ganglion neurons in vivo. We hypothesize that the APC complex also provides retrograde signals that direct presynaptic active zones to develop in register with postsynaptic nAChR clusters. In our model, the APC complex provides retrograde signals via postsynaptic neuroligin that interacts extracellularly with presynaptic neurexin. S-SCAM (synaptic cell adhesion molecule) and PSD-93 (postsynaptic density-93) are scaffold proteins that bind to neuroligin. We identify S-SCAM as a novel component of neuronal nicotinic synapses. We show that S-SCAM, PSD-93, neuroligin and neurexin are enriched at alpha3*-nAChR synapses. PSD-93 and S-SCAM bind to APC and its binding partner beta-catenin, respectively. Blockade of selected APC and beta-catenin interactions, in vivo, leads to decreased postsynaptic accumulation of S-SCAM, but not PSD-93. Importantly, neuroligin synaptic clusters are also decreased. On the presynaptic side, there are decreases in neurexin and active zone proteins. Further, presynaptic terminals are less mature structurally and functionally. We define a novel neural role for APC by showing that the postsynaptic APC multiprotein complex is required for anchoring neuroligin and neurexin at neuronal synapses in vivo. APC human gene mutations correlate with autism spectrum disorders, providing strong support for the importance of the association, demonstrated here, between APC, neuroligin and neurexin.


Figures

Figure 1.
Figure 1.
S-SCAM is enriched at nicotinic synapses on CG neurons in vivo. a, Total CG lysate proteins were separated by SDS-PAGE and immunoblotted for S-SCAM. Protein bands corresponding to expected molecular weights of S-SCAM isoforms were detected, including α (full-length), β, and γ (180, 160, and 105 kDa). b–d, Micrographs of immunofluorescence double-labeled E14 CG frozen sections. S-SCAM surface-associated clusters (red; b, c) are predominantly colocalized with α3*-nAChR (green; b) and APC (green; c) clusters (overlap, yellow). Additionally, S-SCAM clusters (red; d) are juxtaposed to and partially overlap with the presynaptic terminal stained for synaptic vesicle protein SV2 (green; d). Note that CG neurons lack dendrites and organize synapses on both somatic spines and the smooth region of the soma (see diagram of the synapse Fig. 8e). Bottom, Graphs show red and green fluorescence intensity profiles for the boxed regions. Staining intensities covaried and strongly correlated with each other for colocalization of S-SCAM with α3*-nAChRs, APC and SV2 [r, Pearson's correlation coefficient (mean ± SEM), can range from −1.0 to +1.0; n = 2–3 labeled surface areas per neuron, total of 15–20 μm in length, 12–20 neurons].
Figure 2.
Figure 2.
Neuroligin and neurexin are enriched at CG nicotinic synapses in vivo. a, d, Immunoblot analyses of lysates from chicken CG and brain, for comparison, show protein bands of the expected sizes for neuroligin (NL) (∼110 kDa) and neurexin (Nrx) (∼160 kDa for α-Nrx and ∼75 kDa for β-Nrx). b, c, e, f, Micrographs of immunofluorescence double-labeled E12–E14 CG frozen sections show that NL surface clusters (red; b, c) colocalize with α3*-nAChRs clusters (green; b) and partially overlap with the SV2-positive presynaptic terminal (green; c). Similarly, Nrx surface clusters (red; e, f) partially overlap with postsynaptic α3*-nAChR clusters (green; e) and the presynaptic terminal stained for SV2 (green; f). Bottom, Red and green fluorescence intensity profiles for boxed regions; r, correlation coefficients for colocalization (n = 15–18 neurons).
Figure 3.
Figure 3.
S-SCAM links to β-catenin and neuroligin in CG neurons. β-cat (lane 1) and NL (lane 3) coimmunoprecipitated with S-SCAM from CG lysates. In contrast, IQGAP (lane 8) did not. S-SCAM itself precipitated with the S-SCAM antibody (lane 5), but not with the hemagglutinin (HA) antibody, as a negative control (lane 6). CG homogenates were immunoprecipitated (IP) with S-SCAM or HA antibody. The precipitate and 1–2% of total input were separated by SDS-PAGE and immunoblotted (IB) with β-cat antibody (lanes 1 and 2), NL antibody (lanes 3 and 4), S-SCAM antibody (lanes 5–7), or IQGAP antibody (lanes 8 and 9). β-cat ∼92 kDa; NL ∼110 kDa; S-SCAM isoforms: α (full-length), β, and γ, 180, 160, and 105 kDa; IQGAP ∼190 kDa. n = 3 separate experiments.
Figure 4.
Figure 4.
Expression of β-catenin::S-SCAM or APC::EB1 dominant-negative blocking peptides, in vivo, led to decreased accumulation of S-SCAM near the CG neuron surface. a, d, Micrographs of immunofluorescence double-labeled E11–E13 CG frozen sections showing S-SCAM surface-associated clusters (red) were decreased in neurons expressing the HA-tagged β-cat::S-SCAM-dn (DN, green; a) or HA-tagged APC::EB1-dn (DN, green; d) compared with control neurons (Ctl; a, d) [uninfected neurons from the same CG (internal control) or uninfected CGs age-matched and processed in parallel]. HA staining (green) shows that retroviral infection was restricted to CG neurons and occasionally a few glial cells (small HA+ cells; not seen here) that surround the neuronal somata. Insets, twofold magnification views of boxed regions. b, e, Frequency distribution graphs show reductions in the fluorescence pixel intensities of S-SCAM labeling near the surface in β-cat::S-SCAM-dn and APC::EB1-dn-infected neurons (red boxes) versus age-matched Ctl neurons (blue triangles). Dashed vertical lines indicate the median intensity values. c, f, Bar graphs showing 29.6% and 30.7% decreases in mean pixel intensity levels for S-SCAM surface-associated clusters in β-cat:::S-SCAM-dn (c) and APC::EB1-dn (f) neurons relative to Ctl neuron levels (β-cat::S-SCAM-dn: *p < 4.1 × 10⁻¹⁵, Student's t test, n = 21 DN and 21 Ctl neurons; APC::EB1-dn: *p < 5.8 × 10⁻¹⁸, Student's t test, n = 24 DN and 10 Ctl neurons). Bars represent the mean ± SEM. For the quantitative assessments, the fluorescence pixel intensities were measured along 3- to 5-μm-length segments of the brightest labeled surface regions (n = 3 different line segments per neuron, 10–49 DN and Ctl neurons, and 6–12 embryos for each immunolabeling experiment). The values were binned into incremental groups of 10 pixel intensity steps (e.g., 0–9, 10–19, etc., up to saturation). The percentage of pixels that belonged to each pixel intensity category was calculated and the data plotted as a relative frequency distribution (b, e).
Figure 5.
Figure 5.
Expression of APC::EB1-dn does not alter PSD-95 clusters near the neuron surface. a, Micrographs of immunofluorescence double-labeled E12 CG frozen sections showing PSD-95 (red) clusters near the surface are not altered by expression of HA-tagged APC::EB1-dn (DN, green) compared with Ctl neurons from age-matched uninfected CGs processed in parallel. Insets, Twofold magnification views of boxed regions. b, Frequency distribution graph and mean intensity levels (data not shown) indicated no significant difference in pixel intensities of PSD-95 labeling in APC::EB1-dn neurons versus Ctl neurons (p = 0.22, Student's t test, n = 21 DN and 19 Ctl neurons). Dashed vertical lines indicate the median intensity values (b).
Figure 6.
Figure 6.
a–f, Neuroligin surface clusters are decreased in dn-expressing CG neurons. a, f, Micrographs of immunofluorescence double-labeled E11–E13 CG frozen sections. a, d, NL surface clusters (red; a, d) are decreased in neurons expressing HA-tagged β-cat::S-SCAM-dn (DN, green; a) or HA-tagged APC::EB1-dn (DN, green; d) compared with Ctl neurons (Ctl; a, d). Insets, Twofold magnification views of boxed regions. b, c, e, f, NL surface clusters show shifts to lower pixel intensity levels (b, e) as well as 29.5% and 21.5% reductions in mean intensity levels (c, f) in β-cat::S-SCAM-dn and APC::EB1-dn-expressing neurons, respectively, relative to Ctl neurons (β-cat::S-SCAM-dn: *p < 1.8 × 10⁻⁷, Student's t test, n = 16 DN and 16 Ctl neurons; APC::EB1-dn: *p < 6.9 × 10⁻⁶, Student's t test, n = 32 DN and 11 Ctl neurons). Dashed vertical lines indicate the median intensity values (b, e). Bars represent the mean ± SEM (c, f).
Figure 7.
Figure 7.
a–f, Neurexin surface clusters are decreased on presynaptic terminals that contact postsynaptic neurons expressing APC::EB1-dn or β-cat::S-SCAM-dn. a, d, Micrographs of immunofluorescence double-labeled E13 CG frozen sections showing that Nrx surface clusters (red; a, d) are decreased on presynaptic terminals that contact APC::EB1-dn (a) and β-cat::S-SCAM-dn (d) neurons compared with Ctl neurons. Insets, twofold magnification views of boxed regions. b, c, e, f, Nrx staining shows shifts to lower pixel intensity levels (b, e) as well as 31.5% and 22.6% reductions in mean intensity levels (c, f) at synapses on APC::EB1-dn (b, c)- and β-cat::S-SCAM-dn (e, f)-expressing neurons, respectively, relative to Ctl neurons. (APC::EB1-dn: *p < 6.9 × 10⁻⁹, Student's t test, n = 21 DN and 14 Ctl neurons; β-cat::S-SCAM-dn: *p < 5.2 × 10⁻²² Student's t test, n = 22 DN and 21 Ctl neurons). Dashed vertical lines indicate the median intensity values (b, e). Bars represent the mean ± SEM (c, f).
Figure 8.
Figure 8.
Altered architecture of the calyx-type presynaptic terminal on postsynaptic dn-expressing ciliary neurons. a, Micrographs of immunofluorescence double-labeled E13 CG frozen sections show no decrease in SV2-stained synaptic vesicle clusters (red) in presynaptic terminals that contact postsynaptic neurons expressing APC::EB1-dn (DN) compared with terminals on Ctl neurons. b, Presynaptic SV2 labeling shows no significant difference in pixel intensity levels in APC::EB1-dn neurons versus Ctl neurons (p = 0.15, Student's t test; n = 33 DN and 83 Ctl neurons). In contrast, the architecture of the presynaptic calyx-type terminal is altered. c, Threefold magnification views of the boxed regions in a show greater discontinuity in the length of SV2-stained terminals on APC::EB1-dn-positive ciliary neurons versus Ctl ciliary neurons (Ctl). White lines mark the continuous SV2-stained segments. d, Bar graph shows a 24.9% decrease in the mean length of continuous SV2 labeling for calyx terminals on APC::EB1-dn neurons versus age-matched Ctl neurons (*p < 0.04, Student's t test, n = 67 DN and 157 Ctl neurons, 9 or more embryos, 3 independent experiments). e, Schematic representation of maturational changes in architecture of the presynaptic terminal on normal developing embryonic ciliary neurons. The red dots represent synaptic vesicles. During immature stages, multiple boutons fuse to form the calyx. Maturation is complete by E14, all ciliary neurons are contacted by a single large calyx-type terminal. The decrease in mean length of continuous SV2 labeling on E13 ciliary neurons expressing APC::EB1-dn suggests that the presynaptic terminals are less mature.
Figure 9.
Figure 9.
a–i, Presynaptic active zone protein clusters are decreased in terminals that contact postsynaptic neurons expressing APC::EB1-dn or β-cat::S-SCAM-dn. a, d, g, Micrographs of immunofluorescence double-labeled E11–E13 CG frozen sections showing that RIM (red; a) and piccolo (red; d, g) clusters are decreased in presynaptic terminals that contact postsynaptic neurons expressing APC::EB1-dn (a, d) or β-cat::S-SCAM-dn (g) compared with terminals on Ctl neurons. Insets, Twofold magnification views of boxed regions. b, c, e, f, RIM (b, c) and piccolo (e, f,) clusters show shifts to lower pixel intensity levels (b, e) and reductions in mean intensity levels of 18.8% for RIM (c) and 48.2% for piccolo (f) in presynaptic terminals on APC::EB1-dn neurons relative to terminals on Ctl neurons. (RIM, c; *p < 7.6 × 10⁻⁴, Student's t test; n = 28 DN and 49 Ctl neurons; piccolo, d; *p < 8.9 × 10⁻²⁴, Student's t test; n = 27 DN and 10 Ctl neurons). Similarly, piccolo staining shows 28% reductions in mean intensity levels (h, i) in presynaptic terminals on β-cat::S-SCAM-dn-expressing neurons (i, *p < 6.5 × 10⁻¹³, Student's t test; n = 24 DN and 24 Ctl neurons). Dashed vertical lines indicate the median intensity values (b, e, h). Bars represent the mean ± SEM (c, f, i).
Figure 10.
Figure 10.
Blockade of postsynaptic APC::EB1 interactions leads to decreased presynaptic terminal functional maturation. Live neurons with attached intact presynaptic terminals were isolated from APC::EB1-dn-infected CGs and control uninfected CGs at E13.5 using mild dissociation conditions. a, Micrographs show substantial decreases in FM1-43FX labeling of recycling synaptic vesicles during high K+ depolarization of the freshly isolated APC::EB1-dn neurons versus Ctl neurons. b, Cumulative frequency distribution graph showing that FM1-43FX labeled puncta shift to lower peak intensity levels in terminals on APC::EB1-dn neurons relative to terminals on Ctl neurons (n = 13 DN and 23 Ctl neurons, two independent experiments). c, Bar graphs show 30.1% reduction in mean peak intensity levels of FM1-43X labeled clusters in presynaptic terminals on APC::EB1-dn versus Ctl neurons (*p < 0.0048, Student's t test). Bars represent the mean ± SEM.

Similar articles

Cited by

References

    1. Ataman B, Ashley J, Gorczyca M, Ramachandran P, Fouquet W, Sigrist SJ, Budnik V. Rapid activity-dependent modifications in synaptic structure and function require bidirectional Wnt signaling. Neuron. 2008;57:705–718. - PMC - PubMed
    1. Barrow SL, Constable JR, Clark E, El-Sabeawy F, McAllister AK, Washbourne P. Neuroligin1: a cell adhesion molecule that recruits PSD-95 and NMDA receptors by distinct mechanisms during synaptogenesis. Neural Dev. 2009;4:17. - PMC - PubMed
    1. Barth AI, Caro-Gonzalez HY, Nelson WJ. Role of adenomatous polyposis coli (APC) and microtubules in directional cell migration and neuronal polarization. Semin Cell Dev Biol. 2008;19:245–251. - PMC - PubMed
    1. Blundell J, Blaiss CA, Etherton MR, Espinosa F, Tabuchi K, Walz C, Bolliger MF, Sudhof TC, Powell CM. Neuroligin-1 deletion results in impaired spatial memory and increased repetitive behavior. J Neurosci. 2010;30:2115–2129. - PMC - PubMed
    1. Boucard AA, Chubykin AA, Comoletti D, Taylor P, Südhof TC. A splice code for trans-synaptic cell adhesion mediated by binding of neuroligin 1 to alpha- and beta-neurexins. Neuron. 2005;48:229–236. - PubMed

Publication types

MeSH terms

LinkOut - more resources