. 2010 Aug 23;190(4):651-62.
doi: 10.1083/jcb.201005076. Epub 2010 Aug 16.

Oxidative status of muscle is determined by p107 regulation of PGC-1alpha

Affiliations

Oxidative status of muscle is determined by p107 regulation of PGC-1alpha

Anthony Scimè et al. J Cell Biol. .

Abstract

Mice lacking p107 exhibit a white adipose deficiency yet do not manifest the metabolic changes typical for lipodystrophy, and instead exhibit low levels of serum triglycerides and a normal liver phenotype. When fed a high fat diet, p107-null mice still did not accumulate fat in the liver, and display markedly elevated energy expenditures together with an increased energy preference for lipids. Skeletal muscle was therefore examined, as this is normally the major tissue involved in whole body lipid metabolism. Notably, p107-deficient muscle express increased levels of peroxisome proliferator-activated receptor gamma co-activator-1alpha (PGC-1alpha) and contained increased numbers of the pro-oxidative type I and type IIa myofibers. Chromatin immunoprecipitation revealed binding of p107 and E2F4 to the PGC-1alpha proximal promoter, and this binding repressed promoter activity in transient transcription assays. Ectopic expression of p107 in muscle tissue in vivo results in a pronounced 20% decrease in the numbers of oxidative type IIa myofibers. Lastly, isolated p107-deficient muscle tissue display a threefold increase in lipid metabolism. Therefore, p107 determines the oxidative state of multiple tissues involved in whole body fat metabolism, including skeletal muscle.


Figures
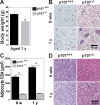
Figure 1.
Figure 1.
Aged p107−/− mice display underdeveloped WAT depots. (A) Graphical representation of the weight of 1-yr-old wild-type and p107−/− mice (n = 5 for p107+/+ and n = 4 for p107−/−). The asterisk denotes significance (P < 0.0003). (B) H&E staining of inguinal WAT for wild-type and p107−/− mice at 8 wk and 1 yr of age. (C) Graphical representation of the mean cross-sectional area (CSA) of white adipocytes for wild-type and p107−/− mice at 8 wk (w) and 1 yr (yr) of age. The asterisk denotes significance (P < 0.009). (D) H&E staining of interscapular BAT for wild-type and p107−/− mice at 8 wk and 1 yr of age. Note the increased lipid deposition in the wild-type animals after 1 yr. Error bars indicate SD.
Figure 2.
Figure 2.
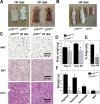
p107−/− mice are refractory to fat accumulation after HF feeding. (A) Representative dorsal view of wild-type and p107−/− mice after 60 d on an HF diet. Note the lack of WAT pads for the p107−/− mouse. (B) Representative gross comparison of testicular fat depots between adult wild-type and p107−/− mice after 60 d on HF diet. (C) H&E staining of inguinal WAT, interscapular BAT, and livers for representative wild-type and p107−/− mice after 60 d on an HF diet. Note the accumulation of lipids within cells of the various tissues for the wild-type mouse but not the p10−/− mouse. (D) Graphical representation of body weight for wild-type and p107−/− mice before (day 0) and after an HF diet for 60 d (day 60; n = 5 and 4 for p107+/+ and p107−/−, respectively). Asterisks indicate significance between wild-type and p107−/− at day 0 (P < 0.03) and day 60 (P < 0.002) and between day 0 and day 60 for wild-type mice (P < 0.02, n = 5 and 4 for p107+/+ and p107−/−, respectively). (E) Percent adiposity for wild-type and p107−/− mice after 60 d of being fed an HF diet (day 60; n = 5 and 4 for p107+/+ and p107−/−, respectively). Asterisks denote significance (P < 0.000006; n = 3). (F) Weights of various fat depots between p107−/− and wild-type male mice after an HF diet for 60 d. Asterisks denote significance for inguinal (P < 0.002), testicular (P < 0.0005), and peritoneal (P < 0.001; n = 3) samples. Note that p107−/− mice do not gain any appreciable weight at the level of lipid accumulation in WAT after HF feeding. Error bars indicate SD.
Figure 3.
Figure 3.
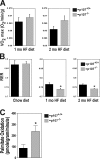
Elevated metabolic rate in p107−/− mice induced by an HF diet. (A) Mean 24 h mass-adjusted total energy expenditure for wild-type and p107−/− mice after 1 mo and 2 mo of HF feeding (n = 4 for both p107+/+ and p107−/−). (B) RER for wild-type and p107−/− mice on a chow diet or at the end of 1 and 2 mo of an HF diet (n = 4 and 5 for p107−/− and p107+/+, respectively). Asterisks denote significance P < 0.05 for 1 mo and P < 0.03 at 2 mo (n = 4 for both p107+/+ and p107−/−). (C) Exogenous palmitate oxidation per gram per minute of gastrocnemius muscle ex vivo over time (n = 12 and 8 for p107−/− and p107+/+, respectively). The asterisk denotes significance (P < 0.02). Error bars indicate SD.
Figure 4.
Figure 4.
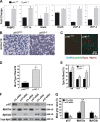
Elevated oxidative function of p107−/− skeletal muscle. (A) Graphical representation of the relative fold change expression between wild-type and p107−/− mice for FABP3, CPT1b, Glut4, Glut5, UCP-2, and UCP-3 in TA muscle using qRT-PCR. Asterisks denote significance (P < 0.05, P < 0.004, P < 0.005, and P < 0.005 for FABP3, CPT1b, UCP-2, and UCP-3, respectively). n = 4 for both p107+/+ and p107−/−. (B) Representative NADH reductase staining with NBT (NADH-TR) of TA fibers for wild-type and p107−/− mice. Note the obvious abundance of darkly stained pro-oxidative fibers for the p107−/− TA. (C) Type I MyHC (red), Laminin (green), and DAPI (blue) fluorescence immunostaining of representative TA sections for wild-type and p107−/− mice. Note the increased levels of oxidative fibers for the p107−/− muscle in the mainly mixed type II muscle. (D) Graphical representation of the number of type I fibers per TA for wild-type and p107−/− mice. The asterisk denotes significance (P < 0.02; n = 3 for both p107+/+ and p107−/−). (E) Graphical representation of the number of type IIa fibers per diaphragm (DM), pectoralis (PEC), and TA for wild-type and p107−/− mice. Note that the different muscle groups have pro-oxidative fibers. The asterisks denote significance (P < 0.05 and P < 0.02 for PEC and TA, respectively; n = 3 for both p107+/+ and p107−/−). (F) Immunoblot triplicates of p107-siRNA knockdown myotubes using antibodies directed against the indicated proteins. A nonsilencing siRNA (CTL-siRNA) was used as a control, and equal protein loading was confirmed by blotting for total MyHC. MyHCIIa, MyHC type IIa; MyHCIIb, MyHC type IIb. (G) Background-corrected gray values from F were normalized to the total MyHC levels, and the CTL-siRNA was set to 100%. Compiled data are expressed as mean ± SEM, with the level of significance indicated as: **, P < 0.01; * P < 0.05. Error bars indicate SD.
Figure 5.
Figure 5.
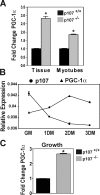
Elevated PGC-1α expression in p107−/− skeletal muscle. (A) Graphical representation of the relative fold change expression for PGC-1α in wild-type and p107−/− TA muscle (Tissue) and differentiated primary myoblasts (Myotubes) using qRT-PCR. Asterisks denote significance (P < 0.004 and P < 0.008 for tissue and myotubes, respectively; n = 3 for both p107+/+ and p107−/−). (B) Graphical representation of the relative expression, using qRT-PCR for PGC-1α and p107 in a time course of differentiation, for primary myoblasts. GM, growth media; 1DM, 2DM, and 3DM, 1, 2 and 3 d in differentiation media, respectively. Note the reciprocal expression pattern for p107 and PGC-1α through differentiation (n = 3). (C) Graphical representation of the relative fold change expression for PGC-1α in wild-type and p107−/− myoblasts in growth using qRT-PCR. Asterisks denote significance (P < 0.004; n = 3 for both p107+/+ and p107−/−). Error bars indicate SD.
Figure 6.
Figure 6.
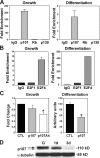
PGC-1α transcription is negatively regulated by p107/E2F binding. (A) Quantitative ChIP assays for control immunoglobulin (IgG), p107, Rb, and p130 to the PGC-1α promoter on a fragment −134 to −445 bp upstream of the transcription start in growth (Growth) and 48 h after differentiation (Differentiation). Results are given as fold enrichment relative to IgG (n = 3). (B) Quantitative ChIP assays for control immunoglobulin (IgG), E2F1, and E2F4 to the PGC-1α promoter on a fragment −134 to −445 bp upstream of the transcription start in growth (Growth) and 48 h after differentiation (Differentiation). Results are given as fold enrichment relative to IgG (n = 3). (C) Underphosphorylated p107 represses PGC1α promoter activity in growth and differentiation. C2C12 cells were transfected with a luciferase reporter driven by the 3.1-kb region upstream of the ATG start site of the PGC-1α gene with empty vector (CTL), or with p107HA and p107A4HA in growth. Cells were also transfected with the luciferase reporter alone (CTL) or with p107HA and differentiated for 2 d. Note that the p107 mutant p107A4HA that is deficient in Cdk2 phosphorylation is able to significantly repress the promoter activity in growth and full-length p107 in differentiation (asterisks denote significance of the mean, P < 0.00000687 and P < 0.0000196, respectively; n = 9). Error bars indicate SD. (D) Western blot for p107 in growth (G) and after 1 (1d) and 3 (3d) days differentiation of C2C12 cells. Note that p107 becomes hypophosphorylated as differentiation progresses.
Figure 7.
Figure 7.
Ectopic expression of p107 influences fiber type determination. (A) Western blot for endogenous p107 and Flag-tagged p107 of electroporated (Elec) Flag-p107 and contralateral untreated (Ctrl) TAs at 10- and 30-d postelectroporation (DPE). (B) PCR detection of electroporated Flag-p107 (Elec) and contralateral untreated (Ctrl) TA muscles after 10- and 30-d DPE. P, Flag-p107; S, empty vector (sham). (C) Type IIa MyHC (red) and Laminin (green) fluorescence immunostaining of representative sections for nonelectroporated and contralateral electroporated TA muscle with empty vector (Sham) or with p107. Note the decreased levels of type IIa oxidative fibers for the p107 electroporated muscle. (D) p107 influences the fiber type character of skeletal muscle in vivo. Graphical representation of the percentage of muscle fibers expressing type IIa MyHC for electroporated TA muscle with empty vector (Sham) or with p107 from their nonelectroporated contralateral TA. Note the significantly reduced oxidative type IIa fibers for p107 expressing TAs. The asterisk denotes significance (P < 0.03; n = 3). Error bars indicate SD.

Similar articles

Cited by

References

    1. Akimoto T., Pohnert S.C., Li P., Zhang M., Gumbs C., Rosenberg P.B., Williams R.S., Yan Z. 2005. Exercise stimulates Pgc-1alpha transcription in skeletal muscle through activation of the p38 MAPK pathway. J. Biol. Chem. 280:19587–19593 10.1074/jbc.M408862200 - DOI - PubMed
    1. Baldi A., Esposito V., De Luca A., Fu Y., Meoli I., Giordano G.G., Caputi M., Baldi F., Giordano A. 1997. Differential expression of Rb2/p130 and p107 in normal human tissues and in primary lung cancer. Clin. Cancer Res. 3:1691–1697 - PubMed
    1. Bassel-Duby R., Olson E.N. 2006. Signaling pathways in skeletal muscle remodeling. Annu. Rev. Biochem. 75:19–37 10.1146/annurev.biochem.75.103004.142622 - DOI - PubMed
    1. Cameron-Smith D., Burke L.M., Angus D.J., Tunstall R.J., Cox G.R., Bonen A., Hawley J.A., Hargreaves M. 2003. A short-term, high-fat diet up-regulates lipid metabolism and gene expression in human skeletal muscle. Am. J. Clin. Nutr. 77:313–318 - PubMed
    1. Czubryt M.P., McAnally J., Fishman G.I., Olson E.N. 2003. Regulation of peroxisome proliferator-activated receptor gamma coactivator 1 alpha (PGC-1 alpha) and mitochondrial function by MEF2 and HDAC5. Proc. Natl. Acad. Sci. USA. 100:1711–1716 10.1073/pnas.0337639100 - DOI - PMC - PubMed

Publication types

MeSH terms

Substances