. 2010 Aug 17;19(2):317-28.
doi: 10.1016/j.devcel.2010.07.008.

Downstream of identity genes: muscle-type-specific regulation of the fusion process

Affiliations

Downstream of identity genes: muscle-type-specific regulation of the fusion process

Laetitia Bataillé et al. Dev Cell. .

Abstract

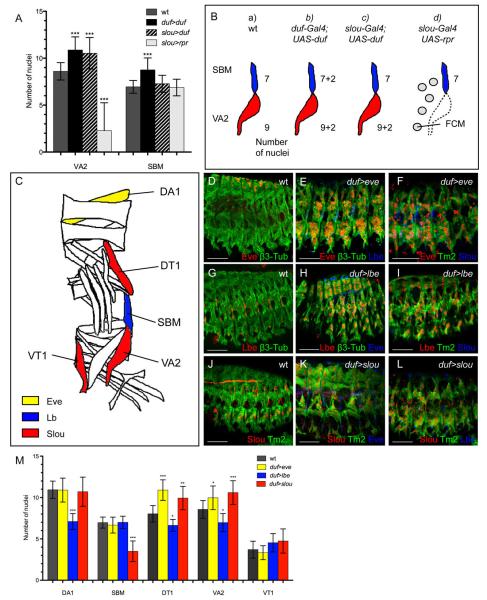
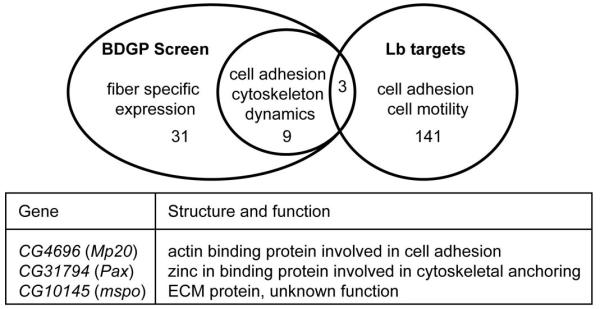
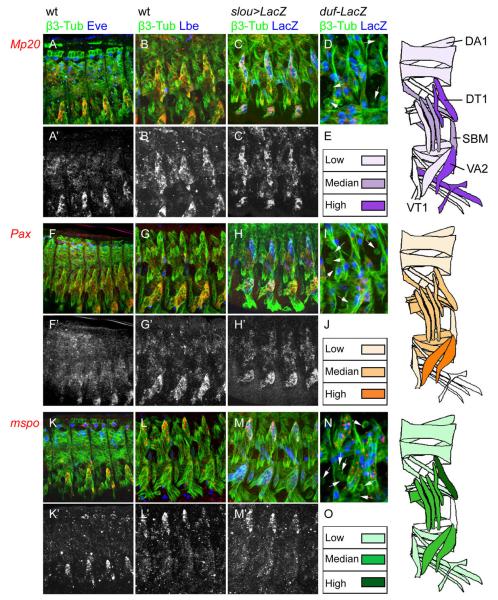
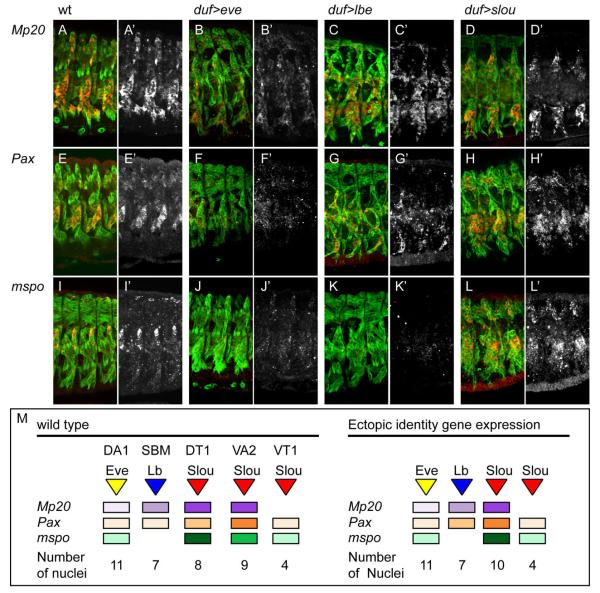
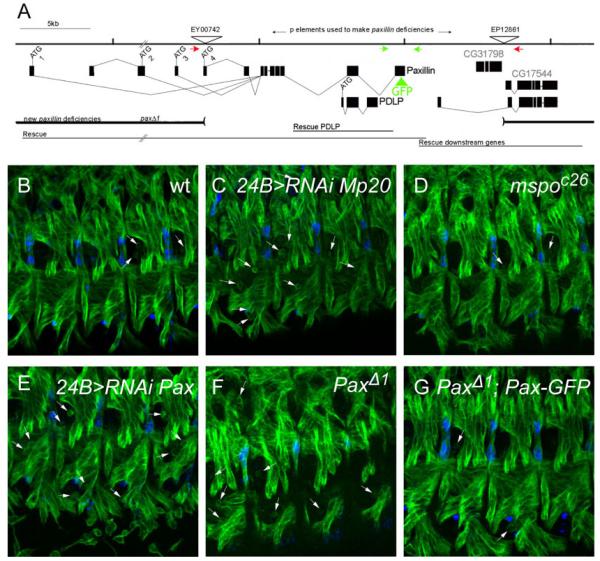
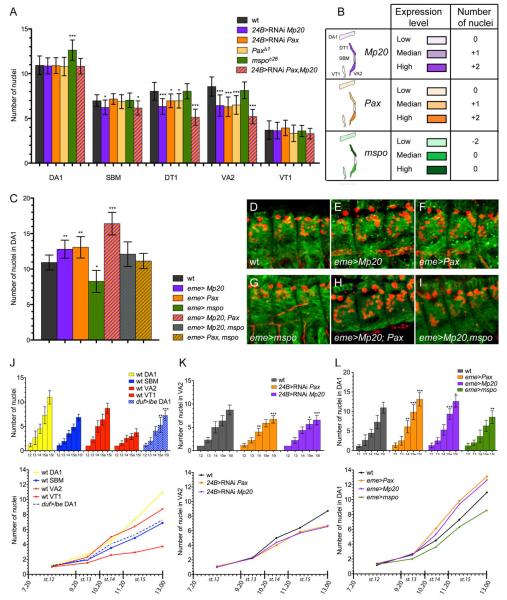
In all metazoan organisms, the diversification of cell types involves determination of cell fates and subsequent execution of specific differentiation programs. During Drosophila myogenesis, identity genes specify the fates of founder myoblasts, from which derive all individual larval muscles. Here, to understand how cell fate information residing within founders is translated during differentiation, we focus on three identity genes, eve, lb, and slou, and how they control the size of individual muscles by regulating the number of fusion events. They achieve this by setting expression levels of Mp20, Pax, and mspo, three genes that regulate actin dynamics and cell adhesion and, as we show here, modulate the fusion process in a muscle-specific manner. Thus, these data show how the identity information implemented by transcription factors is translated via target genes into cell-type-specific programs of differentiation.


Figures

Figure 1
Figure 1. FCs but not FCMs control muscle-type specific fusion programmes
(A) Number of nuclei in SBM and VA2 in wt, duf-Gal4;UAS-duf slou-Gal4;UAS-duf and slou-Gal4;UAS-rpr stage 15 embryos stained for Tm2 and Slou or for ß3-Tub and Lb. The histogram (and all following histograms) show the mean number of nuclei and error bars show standard deviation from the mean. Asterisks show the significance of variation compared to the wt. The values used to plot the graphs are shown in Table S2. All driver controls are presented in Figure S1 and Table S1. (M) Schematic representation of fusion control in SBM and VA2. (a) In wt condition the SBM has 7 nuclei and the VA2 9 nuclei. (b) Pan-muscular duf overexpression leads to an increase in nuclei number in both muscles. (c) Local reduction of FCM number by increasing number of fusion events in the VA2 or (d) local increase of free FCMs by inducing apoptosis in VA2, do not modify the SBM fusion programme. (C) Schematic representation of Eve, Lbe and Slou expression patterns. (D-M) Modified fusion programmes in embryos with ectopic expression of eve, lbe and slou. (D-L) Stage 15 embryos are stained for ß3-Tub or Tm2 (green) to label all muscles and for Eve (D-F, H, K), Lb (G-I, E, L) or Slou (J-L, F, I) to reveal myoblast nuclei in a subset of muscles. wt (D, G, J) and duf-Gal4;UAS-eve (E, F), duf-Gal4;UAS-lbe (H, I), duf-Gal4;UAS-slou (K, L) embryos are shown, dorsal is up and anterior is left. Scale bar correspond to 50μm. In mutant contexts, ectopic expression of Eve, Lbe and Slou is in red and endogenous expression in blue. (M) Number of nuclei in DA1, SBM, DT1, VA2 and VT1 muscles in wild type stage 15 embryos and in embryos with duf-Gal4-driven expression of eve, lbe and slou (see Table S3).
Figure 2
Figure 2. Selection of candidate genes for muscle-specific regulation of fusion process
To select candidates we compared two pools of genes: i) according to BDGP in situ database 554 genes are expressed in larval/embryonic muscle system, among them, 31 show a potential muscle-specific expression (Table S4) and 9 fit into GO category “cell adhesion” or “cytoskeleton dynamics”; ii) The second pool of 141 genes corresponds to a subset of lb target genes (Junion et al., 2007) belonging to the category “cell adhesion/cell motility”. Comparison between these two screens allows us to identify 3 candidates.
Figure 3
Figure 3. Mp20, Pax and mspo display muscle-type specific expression levels
Expression patterns of Mp20 (A-E), Pax (F-J) and mspo (K-O). (A-C’, F-H’, K-M’) in situ hybridization to reveal Mp20, Pax or mspo transcripts (red) coupled to ß3-Tub (green) and muscle-specific staining (blue) for Eve in the DA1 (A, F, K), for Lbe in the SBM (B, G, L) in wt embryos, or for LacZ (C, H, M) in slou-Gal4;UAS-LacZ context to visualize DT1, LO1, VA2 and VT1 muscles. Lateral views of three abdominal segments from stage 15 embryos are shown. Panels (A’-C’, F’-H’, K’-M’) correspond to the red channel only. (D, I, N) Mp20, Pax and mspo expression (in red) in stage 14 duf-LacZ embryos. Growing muscles are visualized with ß3-Tub (green) and LacZ (blue) staining. During fusion process, Mp20, Pax and mspo are expressed only in growing muscles and not in unfused FCMs (white arrows). (E, J, O) Schematic representation of Mp20 (E), Pax (J) and mspo (O) expression levels. High, median and low expression levels are represented by the colour intensity.
Figure 4
Figure 4. Identity genes regulate Mp20, Pax and mspo expression levels
Mp20 (A-D), Pax (E-H) and mspo (I-L) expression patterns in wt (A, E, I), duf-Gal4;UAS-eve (B, F, J), duf-Gal4;UAS-lbe (C, G, K) and duf-Gal4;UAS-slou (D, H, L). For each condition, three abdominal segments of stage 15 embryos are shown. Mp20, Pax or mspo transcripts (red) are revealed by in situ hybridization coupled to staining for ß3-Tub (green). Panels (A’-L’) show the red channel only. Complementary dorsal views are presented in Figure S3. (M) Schematic representation of identity genes dependent regulation of Mp20, Pax and mspo expressions and corresponding fusion programmes in DA1, SBM, DT1, VA2 and VT1 muscles. In wt embryos, Eve, Lb and Slou induce a specific expression level of Mp20, Pax and mspo leading to the execution of a specific fusion programme. Ectopic Eve, Lbe and Slou modulate target’s expression level and leads to the induction of a new fusion programme mimicking that induced by a given identity gene in wt condition.
Figure 5
Figure 5. Loss of Mp20 or Pax functions leads to discrete fusion defects
(A) Diagram of the Pax locus, showing the four Pax transcripts and the short Pax-derived LIM only protein (PDLP). Two P-element insertions, EY00742 and EP12861, were used to generate deletions of the locus. Rescue constructs encompassing the Pax locus, PDLP only, or the downstream genes were generated. Red arrows indicate the position of the primers used to screen the candidate deletions. Green arrows represent the primers used to differentiate the wt allele vs the rescued Pax allele. (B) wt and (C-G) loss of function contexts for Mp20, Pax and mspo. Lateral views of stage 15 embryos stained for β3-Tub (green) and Lbe (blue) are shown. Arrows indicate unfused FCMs. Compared to the wt (A) an increased number of unfused cells is present in 24B-Gal4; UAS-RNAi Mp20 (C), 24B-Gal4; UAS-RNAi Pax (E) and PaxΔ1 (F) embryos. In mspo mutant embryos (D) and in PaxΔ1; Pax-GFP rescue context (G) the number of unfused cells is similar to that in the wt.
Figure 6
Figure 6. Mp20, Pax and mspo modulate fusion process in a muscle-type specific manner and according to their expression level
(A) Number of nuclei present in DA1, SBM, DT1, VA2 and VT1 muscles at stage 15 embryos analyzed in wt, 24B-Gal4; UAS-RNAi Mp20, 24B-Gal4; UAS-RNAi Pax, PaxΔ1, mspoc26 and 24B-Gal4; UAS-RNAi Pax; UAS-RNAi Mp20. To determine the number of nuclei, embryos were double-stained for Eve (DA1), Lbe (SBM) or Slou (DT1, VA2, VT1) and for β3-Tub or Tm2. Bar graphs show the mean number of nuclei and asterisks indicate the significance of variation compared to the wt. The mean values used to plot the graphs are shown in Table S5. (B) Summary of Mp20, Pax and mspo functions correlated to their expression levels. (C-I) Effect of Mp20, Pax and mspo gain of function on number of nuclei in DA1 muscle. (C) Bar graphs show the mean number of nuclei in DA1 muscle, in wt and in gof conditions for Mp20, Pax and mspo and asterisks indicate the significance of variation compared to the wt. Values used to plot the graphs are shown in Table S6. (D-I) Stage 15 embryos stained for Eve and β3-Tub. Dorsal portion of three segments in wt, eme-Gal4;UAS-Mp20, eme-Gal4;UAS-Pax, eme-Gal4;UAS-mspo and double gof contexts eme-Gal4;UAS-Pax;UAS-Mp20 and eme-Gal4;UAS-Mp20;UAS-mspo are shown. (J-L) Kinetics of fusion in wt and duf-Gal4; UAS-lbe (J) in Pax and Mp20 attenuation (K) and Pax, Mp20 and mspo overexpression (L) contexts. VA2 and DA1 muscles were analysed in attenuation and overexpresion contexts, respectively. In upper panels bar graphs show the mean number of nuclei, asterisks show the significance of variation compared to the wt. The values used to plot the graphs are shown in Table S7. In lower panel, only mean values are used to visualize the number of nuclei according to time AEL.
Figure 7
Figure 7. Identity genes control muscle specific fusion programmes by determining combinatorial code of expression levels of their targets
The identity genes eve, lb and slou are required for specification of FCs that give rise to DA1, DT1, SBM, VA2 and VT1 muscles. The FC specification step is completed by stage 12 of embryogenesis but expression of eve, lb and slou continues in later stages. Between, stage 12 and 15, FCs fuse with a determined number of FCMs to generate muscles with a specific number of nuclei. eve, lb and slou induce the recruitment of 10, 6 and 3 nuclei respectively, leading to the DA1, SBM and VT1 formation. Slou in combination with unidentified factors induce two other fusion programmes for DT1 and VA2 muscles. To execute muscle-specific fusion programmes, the identity genes act via Mp20, Pax and mspo by establishing a combinatorial code of target’s expressions. Bold outlines show the target activity in fusion programme.

Similar articles

Cited by

References

    1. Abmayr SM, Zhuang S, Geisbrecht ER. Myoblast fusion in Drosophila. Methods Mol Biol. 2008;475:75–97. - PubMed
    1. Artero R, Furlong EE, Beckett K, Scott MP, Baylies M. Notch and Ras signaling pathway effector genes expressed in fusion competent and founder cells during Drosophila myogenesis. Development. 2003;130:6257–72. - PubMed
    1. Ayme-Southgate A, Lasko P, French C, Pardue ML. Characterization of the gene for mp20: a Drosophila muscle protein that is not found in asynchronous oscillatory flight muscle. J Cell Biol. 1989;108:521–31. - PMC - PubMed
    1. Bate M. The embryonic development of larval muscles in Drosophila. Development. 1990;110:791–804. - PubMed
    1. Baylies MK, Michelson AM. Invertebrate myogenesis: looking back to the future of muscle development. Curr Opin Genet Dev. 2001;11:431–9. - PubMed

Publication types

MeSH terms

LinkOut - more resources