. 2010 Aug 17;19(2):270-83.
doi: 10.1016/j.devcel.2010.07.009.

MIM and cortactin antagonism regulates ciliogenesis and hedgehog signaling

Affiliations

MIM and cortactin antagonism regulates ciliogenesis and hedgehog signaling

Marina Bershteyn et al. Dev Cell. .

Abstract

The primary cilium is critical for transducing Sonic hedgehog (Shh) signaling, but the mechanisms of its transient assembly are poorly understood. Previously we showed that the actin regulatory protein Missing-in-Metastasis (MIM) regulates Shh signaling, but the nature of MIM's role was unknown. Here we show that MIM is required at the basal body of mesenchymal cells for cilia maintenance, Shh responsiveness, and de novo hair follicle formation. MIM knockdown results in increased Src kinase activity and subsequent hyperphosphorylation of the actin regulator Cortactin. Importantly, inhibition of Src or depletion of Cortactin compensates for the cilia defect in MIM knockdown cells, whereas overexpression of Src or phospho-mimetic Cortactin is sufficient to inhibit ciliogenesis. Our results suggest that MIM promotes ciliogenesis by antagonizing Src-dependent phosphorylation of Cortactin and describe a mechanism linking regulation of the actin cytoskeleton with ciliogenesis and Shh signaling during tissue regeneration.


Figures

Figure 1
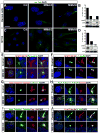
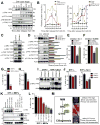
Figure 1. MIM is required for primary cilia formation
(A–D) Primary dermal cells from mouse skin (A,B) and 10T1/2 cells (C,D) were serum starved overnight and stained for primary cilia with antibody to acetylated α-tubulin (green) and DNA (blue). Representative fields are shown in (A,C). Scale bar is 10 μm. (B,D) % of cells with primary cilia in dermal (B) and 10T1/2 (D) cells following MIM KD. More than 300 cells from representative fields were analyzed. Below each graph is a corresponding Western analysis for MIM and Actin. The numbers below the MIM blots indicate relative MIM protein levels in each lane based on densitometry measurements performed with ImageJ software. (E–J) IF of representative control or MIM KD primary dermal cells with indicated antibodies to basal body, centrioles and ciliary shaft proteins. Scale bar represents 5 μm. Regions within the boxes outlined by a dotted white line are shown at higher magnification to the right.
Figure 2
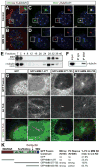
Figure 2. MIM localizes to the basal body
(A–D) IF of representative control (A,C) and MIM KD (B,D) dermal cells with antibodies to MIM (green), acetylated α-tubulin (A,B, red) or γ-tubulin (C,D, red) and DNA (blue). Scale bar represents 2 μm. Regions inside the white boxes are shown at higher magnification in the top right corner of the corresponding panels. (E) Western analysis for MIM and the centrosomal marker γ-tubulin after isolation of centrosomes from 10T1/2 cells. T=Total cell lysate; C=Crude extract prior to sucrose fractionation. (F) Western analysis for γ-tubulin after immunoprecipitation (IP) with control IgG or antibody against MIM from primary dermal cell lysates. (G–J) Cells were transfected with various GFP-hMIM constructs and stained with antibody to acetylated α-tubulin (red). Scale bar represents 5 μm. (K) Schematic of MIM structural domains (with an arrow pointing out the proline-rich region in the C-terminus of MIM that interacts with Cortactin) and the GFP-hMIM constructs used in this study. On the right side is a summary of basal body localization and cilia rescue activity in primary mouse dermal cells based on 3 separate experiments. The last column shows percentage of GFP-positive MIM KD cells with primary cilia normalized to GFP-positive control cells.
Figure 3
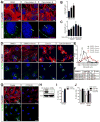
Figure 3. Actin and Cortactin inhibit ciliogenesis
(A,D,G) IF with antibody to acetylated α-tubulin (green), phalloidin (red) and DNA (blue). (A–B) Serum starved 10T1/2 cells were treated for 90 minutes with DMSO, Cytochalasin D or Cytochalasin B prior to fixation and staining. (A) Representative images. Scale bar represents 5 μm. Regions within white dotted boxes are shown at higher magnification in the bottom panels. Cilia in the bottom panels were measured using LSM image browser software, and the lengths are shown in the lower right corner. (B) Corresponding average cilia lengths. DM=DMSO; CD/CB=Cytochalasin D or B, respectively. At least 40 cilia were measured from each treatment group. Error bars show SD. (C) Average primary cilia lengths in 10T1/2 cells treated with cytochalasin B followed by drug washout for the indicated time periods. At least 30 cilia were measured from each time point. Error bars show SD. (D–F) Confluent primary dermal cells were serum starved overnight and then incubated with serum-free or 10% FBS containing medium supplemented with DMSO or Cytochalasin B for four hours prior to fixation and staining. (D) Representative images. Scale bar represents 5 μm. (E) Cilia lengths distribution. Over 200 cilia were measured from each treatment group in three separate experiments. (F) Summary of the results. The difference between cilia lengths in Cytochalasin B treated cells ± serum is not statistically significant. (G–I) Following control or Cortactin knockdown (KD) in primary dermal cells, equal numbers of cells were plated and serum-starved overnight prior to fixation and staining. (G) Representative images. Scale bar represents 10 μm. (H) Western analysis for CTTN and Actin following CTTN KD. (I) % cells with primary cilia. More than 1500 cells were analyzed from each treatment group in six separate experiments. Error bars show SEM. (J) Primary mouse dermal cells from control, CTTN KD or CTTN KD transfected with wt human CTTN were serum-starved for 24 hrs. During the final 4 hrs prior to fixation and staining, half of the cells were incubated with medium containing 10% FBS. % cells with primary cilia. For control and CTTN KD, more than 1200 cells were analyzed from each treatment group in four separate experiments. For the rescue experiment more than 225 transfected cells were analyzed in two separate experiments. Error bars show SEM. Statistics: unpaired two-tailed t-tests were done for experiments that were performed at least three times. Stars indicate statistically significant differences. *p<0.05; **p<0.01; ***p<0.001.
Figure 4
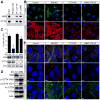
Figure 4. MIM promotes ciliogenesis by antagonizing Cortactin
(A) Western analysis for MIM and CTTN after immunoprecipitation with antibodies to MIM or CTTN from γ-tubulin-positive centrosomal fractions isolated from 10T1/2 cells. (B–C) Following control, MIM, CTTN or MIM/CTTN KD, equal numbers of confluent primary dermal cells were serum-starved overnight. (B) Representative IF with antibody to acetylated α-tubulin (green), phalloidin (red) and DNA (blue). Scale bar represents 20 μm. (C) % cells with cilia with corresponding western blots for MIM, CTTN and Actin. More than 850 cells were analyzed from each knockdown group in three separate experiments. Error bars show SEM. * Indicates a statistically significant difference (p<0.05). There is no statistically significant difference between MIM/CTTN KD and control. (D) Western analysis for the indicated proteins in serum starved dermal cell lysates after control or MIM KD. (E) The experiment described in (B–C) was performed in 10T1/2 cells. Representative images of IF with antibodies to acetylated α-tubulin (white), pCTTN-Y466 (red), phalloidin (green) and DNA (blue). Scale bar represents 5 μm.
Figure 5
Figure 5. MIM promotes ciliogenesis by inhibiting Src kinase activation
(A) Western analysis for the indicated proteins during cell cycle progression of primary dermal cells synchronized by serum starvation (see methods). Densitometry was performed with ImageJ software. (B) Expression of cell cycle proteins p-RB S807/811 and p-CDC2 Y15 was used to determine the timing of G1/S transition (left graph). MIM levels are higher in G1/S and decrease during G2/M, whereas p-Src Y416 and p-CTTN Y466 levels progressively increase towards G2/M (right graph). Note: there was not enough sample from the earlier time points to analyze p-Src, which is why relative p-Src protein levels were normalized against the 28 hr sample and plotted against the right Y-axis. (C) Western analysis for MIM, p-Src and several indicated Src substrates in serum-starved dermal cell lysates after control or MIM KD. (D–F) Serum starved control and MIM KD dermal cells were treated with Src inhibitor I for 2 hrs (D–E) or SU6656 for 6 hrs (F). (D) Western analysis with relative protein levels represented by the bar graph. Note that hyperphosphorylation of SRC substrates in MIM KD cells is at least partially reversible upon Src inhibition for just 2 hrs. (E, F) % cells with cilia normalized to control DMSO samples. More than 400 cells were analyzed from each treatment group in two separate experiments. (G, H) Cilia analysis in confluent serum-starved SYF−/− and SYF−/−; Src+ MEFs. (G) % cilia. More than 750 cells were analyzed in four experiments. (H) cilia length. More than 150 cilia were measured. (I, J) MIM KD in SYF−/− and SYF−/−; Src+ MEFs. (I) Western analysis for MIM, activated p-SRC Y416 and Actin. The numbers below the blots indicate relative protein levels in each lane. (J) % cilia. More than 350 cells were analyzed in three experiments. (K, L) SYF−/− MEFs were transfected with the indicated DsRed CTTN or GFP SRC constructs and the effect of the corresponding proteins on primary cilia was compared to SYF−/− MEFs transfected with DsRed/GFP plasmids as well as to untransfected SYF−/−; Src+ MEFs. (K) Western analysis for the indicated proteins. Notes: GFP SRC proteins are higher MW than endogenous SRC and are not shown in the western blot, however, their expression and function is evident from induction of p-CTTN Y421. Also, while SYF−/− MEFs have plenty of endogenous CTTN, it is not normally phosphorylated. (L) % transfected (except in the case of SYF−/−; Src+) cells with primary cilia. More than 300 cells were analyzed in three experiments. In all the figures error bars show SEM. Statistics: unpaired two-tailed t-tests were done for experiments that were performed at least three times. Stars indicate statistically significant differences. *p<0.05; **p<0.01; ***p<0.001. (M) Model of how MIM promotes ciliogenesis by inhibiting Srcactivation and CTTN phosphorylation. Normally during G1/S the relative ratio of MIM to pSrcand pCTTN is high, which was shown in vitro to inhibit actin polymerization (Lin et al., 2005). We find that inhibition of actin polymerization promotes cilia maintenance and elongation. As the cell cycle progresses, a drop in the ratio of MIM to pSrc and pCTTN levels promotes increased F-actin polymerization, which inhibits ciliogenesis and promotes disassembly. In MIM KD cells activation of Src leads to upregulation of pCTTN, shifting the relative ratio of MIM to pCTTN to low (similar to what is seen normally during G2/M), which correlates with increased actin polymerization and inhibits ciliogenesis.
Figure 6
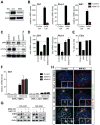
Figure 6. MIM is required for dermal Shh signal responsiveness
(A, B) Following MIM KD, confluent cultures of primary mouse dermal cells were treated with control or ShhN conditioned media (CM). (A) Western analysis for MIM. (B) qRT-PCR results showing relative mRNA levels of the indicated genes. (C–E) Following control, MIM, CTTN or MIM/CTTN KD, confluent cultures of primary mouse dermal cells were treated with control or ShhN CM. (C) Western analysis for MIM, CTTN and Actin. The numbers below indicate relative protein levels in each lane. (D) qRT-PCR results showing fold Gli1 and Ptch1 mRNA induction with ShhN normalized to control CM. (E) % cells with cilia in this experiment. (F) Following MIM KD with two separate hairpins, confluent cultures of SYF−/− and SYF−/−; Src+ MEFs were treated with control or ShhN CM. qRT-PCR results of relative Gli1 mRNA levels are shown. Similar results were obtained for Ptch1 (not shown). (G–H) Control or MIM KD primary dermal cells were transduced with retroviral constructs expressing HA-hGli1 or HA-mGli2 and treated with DMSO or MG132 for 4 hrs. (G) Western analysis for MIM, HA-Gli1, HA-Gli2 and Actin. (H) Representative IF images with antibody to acetylated α-tubulin (red), HA-tag (green) and DNA (blue). Where applicable, error bars show SD based on three technical replicates.
Figure 7
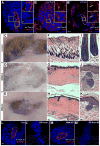
Figure 7. Dermal MIM is required for hair follicle regeneration
(A) Longitudinal section of an anagen hair follicle showing the distal portion or base of the follicle. IF with antibodies to Adenyl Cyclase III (green) to mark the primary cilia, Versican (red) to mark the dermal papilla (DP, outlined by the dotted white line) and DNA (blue). Boxes 1 and 2 in the main image are shown at higher magnification to the right. Box 1 shows primary cilia in DP cells and Box 2 shows primary cilia in nearby keratinocytes. (B) Cross section of an anagen hair follicle at the base. IF with antibodies to Adenyl Cyclase III (green), MIM (red) and DNA (blue). The DP is outlined by the dotted white line. Scale bar represents 5 μm in the main images and 1 μm in the insets. (B,B′) Two different confocal z-planes showing that MIM immunoreactivity at the ciliary base is enriched in keratinocytes (B) and in DP cells (B′). (C–E) Photographs of representative control and MIM KD grafts. A total of two to four grafts were performed in each case. (F–K) Representative H&E sections from control and MIM KD grafts. Original magnification was 5× (F–H) and 20× (I–K). (L and M) IF of a representative control (L) and MIM KD (M) hair follicles with antibodies against Adenyl Cyclase III (green), Versican (red), and DNA (blue). DP is outlined by the dotted white line. Scale bar represents 5 μm. (L′ and M′) 3D projection of the DP from the control (L) or MIM KD (M) hair follicle.

Comment in

  • Multiplexing MIM.
    Kozminski KG, Schafer DA. Kozminski KG, et al. Dev Cell. 2010 Aug 17;19(2):189-90. doi: 10.1016/j.devcel.2010.07.021. Dev Cell. 2010. PMID: 20708580

Similar articles

Cited by

References

    1. Adams M, Smith UM, Logan CV, Johnson CA. Recent advances in the molecular pathology, cell biology and genetics of ciliopathies. J Med Genet. 2008;45:257–267. - PubMed
    1. Ammer AG, Weed SA. Cortactin branches out: roles in regulating protrusive actin dynamics. Cell Motil Cytoskeleton. 2008;65:687–707. - PMC - PubMed
    1. Bompard G, Sharp SJ, Freiss G, Machesky LM. Involvement of Rac in actin cytoskeleton rearrangements induced by MIM-B. J Cell Sci. 2005;118:5393–5403. - PubMed
    1. Callahan CA, Ofstad T, Horng L, Wang JK, Zhen HH, Coulombe PA, Oro AE. MIM/BEG4, a Sonic hedgehog-responsive gene that potentiates Gli-dependent transcription. Genes Dev. 2004;18:2724–2729. - PMC - PubMed
    1. Caspary T, Larkins CE, Anderson KV. The graded response to Sonic Hedgehog depends on cilia architecture. Dev Cell. 2007;12:767–778. - PubMed

Publication types

MeSH terms