. 2010 Nov 18;29(46):6102-14.
doi: 10.1038/onc.2010.351. Epub 2010 Aug 9.

Trisomic dose of several chromosome 21 genes perturbs haematopoietic stem and progenitor cell differentiation in Down's syndrome

Affiliations
Free PMC article

Trisomic dose of several chromosome 21 genes perturbs haematopoietic stem and progenitor cell differentiation in Down's syndrome

S De Vita et al. Oncogene. .
Free PMC article

Abstract

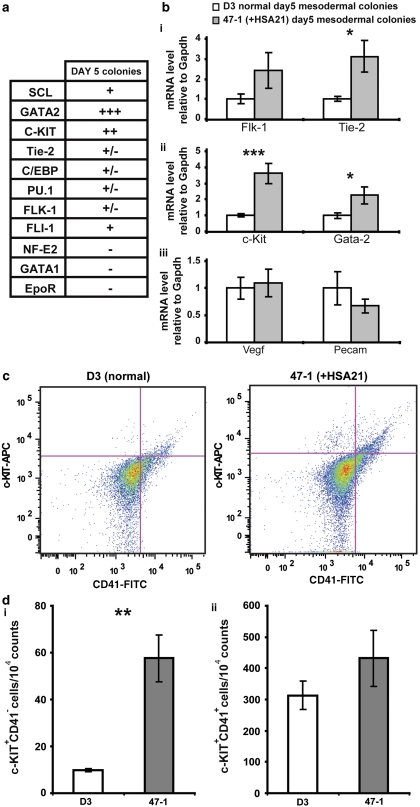
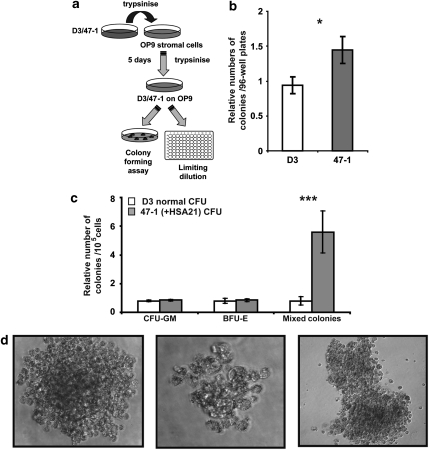
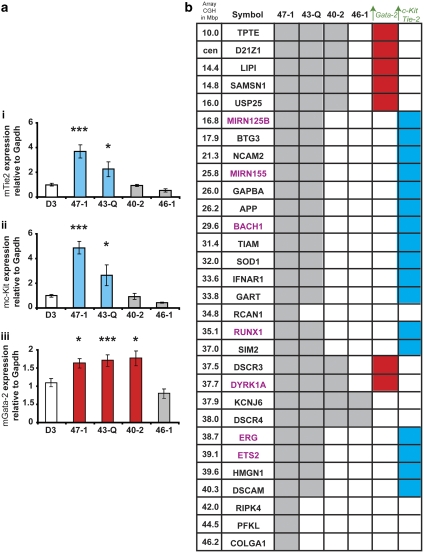
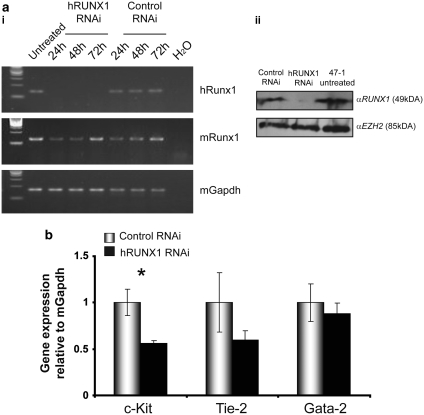
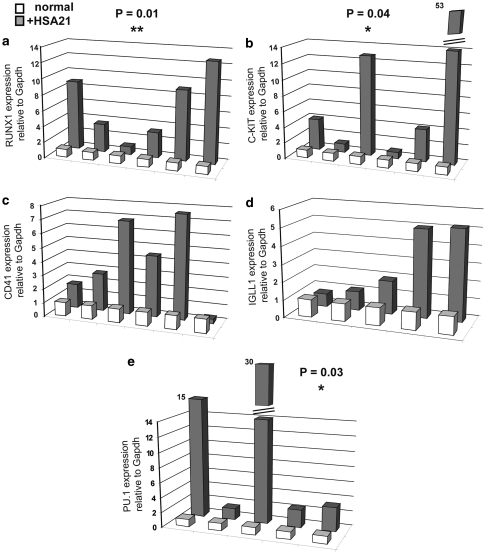
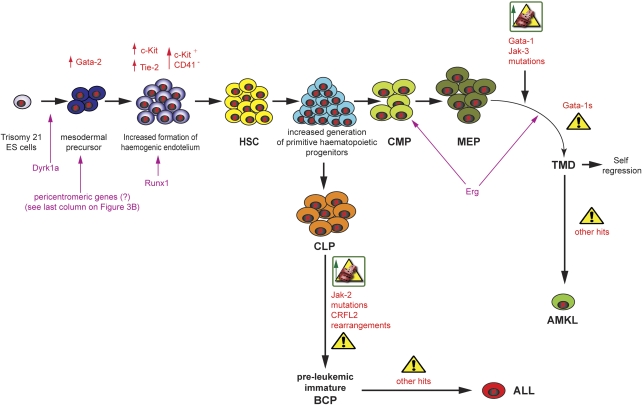
Children with Down's syndrome (DS) have 20-50-fold higher incidence of all leukaemias (lymphoid and myeloid), for reasons not understood. As incidence of many solid tumours is much lower in DS, we speculated that disturbed early haematopoietic differentiation could be the cause of increased leukaemia risk. If a common mechanism is behind the risk of both major leukaemia types, it would have to arise before the bifurcation to myeloid and lymphoid lineages. Using the transchromosomic system (mouse embryonic stem cells (ESCs)) bearing an extra human chromosome 21 (HSA21)) we analyzed the early stages of haematopoietic commitment (mesodermal colony formation) in vitro. We observed that trisomy 21 (T21) causes increased production of haemogenic endothelial cells, haematopoietic stem cell precursors and increased colony forming potential, with significantly increased immature progenitors. Transchromosomic colonies showed increased expression of Gata-2, c-Kit and Tie-2. A panel of partial T21 ESCs allowed us to assign these effects to HSA21 sub-regions, mapped by 3.5 kbp-resolution tiling arrays. The Gata-2 increase on one side, and c-Kit and Tie-2 increases on the other, could be attributed to two different, non-overlapping HSA21 regions. Using human-specific small interfering RNA silencing, we could demonstrate that an extra copy of RUNX1, but not ETS-2 or ERG, causes an increase in Tie-2/c-Kit levels. Finally, we detected significantly increased levels of RUNX1, C-KIT and PU.1 in human foetal livers with T21. We conclude that overdose of more than one HSA21 gene contributes to the disturbance of early haematopoiesis in DS, and that one of the contributors is RUNX1. As the observed T21-driven hyperproduction of multipotential immature precursors precedes the bifurcation to lymphoid and myeloid lineages, we speculate that this could create conditions of increased chance for acquisition of pre-leukaemogenic rearrangements/mutations in both lymphoid and myeloid lineages during foetal haematopoiesis, contributing to the increased risk of both leukaemia types in DS.


Figures

Figure 1
Figure 1
Assessment of the transcriptional and cell-surface profile of day 5 mesodermal colonies generated from transchromosomic ES cells: T21 ESCs produce an increased number of haemogenic endothelial cells. (a) qRT–PCR measurements of mRNA levels of several markers of the haematopoietic stem cell compartment (HSCs) and of lineage progenitors such as the common myeloid progenitors (CMP), the granulocyte-macrophage progenitors (GMP) and the megakaryocyte-erythroid progenitors (MEP). Symbols depict relative amounts of mRNA in each population relative to mGapdh: less than 0.001 (–); 0.001–0.01 (±); 0.01–0.1 (+); 0.1–100 (++); >100 (+++). (b) qRT–PCR analysis of mRNA levels in day 5 mesodermal colonies derived from D3 and 47-1. Mean mRNA levels of the gene of interest are expressed as fold changes of levels in D3 cells. Error bars indicate the s.e.m. (i) Markers of mesodermal differentiation. A significant difference was observed in the transcript levels Tie-2 (t-test; P-value=0.02). Values are the mean of three and six independent experiments for Flk-1 and Tie-2, respectively. (ii) Markers of the HSC/immature haematopoietic precursor compartment. A significant difference was found in the expression of c-Kit and Gata-2 between D3 and 47-1 (t-test; P-value=0.009 and 0.03, respectively). Data shown are from nine independent experiments. (iii) Markers of endothelial differentiation. No significant difference in the levels of Pecam and Vegf was observed between colonies derived from D3 and 47-1 at day 5 of differentiation. (c) FACS analysis of colonies derived from ESCs D3 and 47-1 at day 5 of differentiation. Staining was performed with anti-CD41-FITC and anti-c-Kit-APC. Data were collected on a LSRII (BD Biosciences, Oxford, UK) instrument and analyzed with FlowJo software version 8.1. Two-colour fluorescence dot plots are shown for D3 and 47-1. (d) Quantification of the c-Kit+CD41 and of the c-Kit+CD41+ population. (i) is showing the frequency of c-Kit+CD41 cells and (ii) is showing the frequency of c-Kit+CD41+ cells in both D3 and 47-1. The frequency of cells positive for c-Kit and negative for CD41 was significantly higher in the trisomic cells than in the control (t-test; P-value=0.009). Data shown in both charts represents the average percentage of three independent experiments. Error bars indicate s.e.m. A full colour version of this figure is available at the Oncogene journal online.
Figure 2
Figure 2
Functional analysis of haematopoietic progenitors derived from the transchromosomic and the parental ES cell lines. (a) Schematic of the assays used for the functional analysis of day 5 colonies derived from 47-1 (+HSA21) and D3 (euploid) ES cell lines. In brief, the limited-dilution assay day 5 mesodermal colonies were treated with trypsin, counted and replated at a density of 500 cells/plate in a 96-well plate on a fresh layer of OP9 cells. The number of haematopoietic colonies generated from D3 cells and 47-1 cells under these conditions was assessed at day 12. For the colony-forming assay, cells obtained from day 5 mesodermal colonies were seeded on a fresh OP9 layer in 6-well plates. At day 8 of differentiation, the developing haematopoietic cells were harvested and plated in methylcellulose-based medium supplemented with IL-3, IL-6 and EPO. Colonies were counted and classified according to morphology on day 14. (b) Bar graph representing the average number of 47-1 (+HSA21) colonies relative to the average number of D3 (euploid) colonies counted in ten 96-well plates (five independent cultures were seeded in duplicate). t-test P-value=0.03, error bars indicate s.e.m. (c) Colony-forming unit (CFU) assay. Bar chart showing the average number of myeloid colonies, erythroid colonies and mixed colonies in three independent experiments, normalized in each case to the value obtained for the normal, D3 ESCs. Error bars indicate s.e.m. A very high statistically significant difference was detected between 47-1 (+HSA21) and D3 (euploid) cells in the number of mixed colonies (t-test; P-value<0.001). (d) Morphology of colonies generated from haematopoietic progenitors in semi-solid medium supplemented with IL-3, IL-6 and EPO, following the Methocult protocol criteria. The figure shows the three types of colonies scored at day 14 after seeding in semi-solid medium. Pictures were taken using a light microscope with an × 20 objective.
Figure 3
Figure 3
Genetic dissection of HSA21 for the role in mesodermal colony haematopoietic disturbance using partially trisomic ES cell lines. (a) Comparison of the molecular changes observed in +HSA21 ES cell line 47-1, across a panel of partially trisomic ESC lines, 43-Q, 40-2 and 46-1. Bar charts show the average mRNA levels of a minimum of three independent experiments. Data are represented as fold change relative to levels in D3 parental cells. Error bars indicate s.e.m. Levels of Tie-2 and c-Kit mRNA were significantly upregulated in 43-Q, but not in 42-0 and 46-1 (i and ii), compared with the D3 control (t-test; P-value=0.018 and 0.03, respectively). (iii) Levels of Gata-2 mRNA were significantly increased in both 43-Q and 42-0, but not in 46-1, compared with the D3 euploid control (t-test; P-value=0.007 and 0.01, respectively). (b) Characterization of HSA21 content of the transchromosomic ES cell lines. Data obtained from HR–CGH array. Light grey bars indicate that a given gene on HSA21 is present in the ES cell line; white bars indicate that the gene is absent. Regions that might be responsible for the increased Gata-2 and the increased c-Kit/Tie-2 phenotypes of mesodermal colonies are highlighted in red and blue respectively. In purple are indicated other HSA21 genes that may be contributing to the c-Kit and Tie-2 disturbance because of their published link with myelo-erythropoiesis.
Figure 4
Figure 4
Effects of the reduction of RUNX1 to disomy in differentiating +HSA21 ESCs (a) (i) RT–PCR analysis performed on cDNA extracted from untreated 47-1 (+HSA21), 47-1 transfected with RNAi oligonucleotides targeting hRUNX1 or with non-targeting RNAi control at different time points. RT–PCR was performed on the same samples with primers specific for hRUNX1, mRunx1 and mGapdh. Cells were harvested for total RNA extraction at the indicated time points after transfection. (ii) Western blot performed on untreated 47-1, 47-1 transfected with oligos targeting hRUNX1 and non-targeting oligos. Nuclear extracts were generated from cells harvested 72 h after transfection. The membrane was probed with a mouse monoclonal antibody anti-RUNX1 and with a rabbit polyclonal antibody against the mouse nuclear protein EZH2 was used as a loading control. (b) The qRT–PCR analysis of mRNA levels for c-Kit, Tie-2 and Gata-2 in day 5 mesodermal colonies derived from 47-1 cells, transfected with RNAi targeting hRUNX1 or non-targeting RNAi control. The mRNA levels were measured 6 days post transfection. Bar charts represent the mean mRNA levels normalized to mGapdh and relative to control samples transfected with non-targeting RNAi sequence (n=3). Error bars indicate s.e.m. There was a significant reduction (t-test; P-value=0.04) of the levels of c-Kit in the hRUNX1 RNAi compared with the control.
Figure 5
Figure 5
Human FL with trisomy 21 shows increased levels of early haematopoietic markers. qRT–PCR analysis of mRNA levels for RUNX-1, C-KIT, CD41, PU1 and IGLL-1 in FLs from Down's syndrome (DS) and matched euploid controls. Data are presented as ratios of mRNA levels for each DS and its matched euploid control. Significance was calculated by Wilcoxon's signed-rank test. Levels of RUNX1, PU.1 and C-KIT were found to be significantly higher in DS compared with euploid samples (P-value=0.01, 0.03 and 0.04, respectively).
Figure 6
Figure 6
Stochastic model of leukaemogenesis in Down's syndrome (DS), pointing at multiple effects of several trisomic HSA21 genes. The HSA21 genes are shown in purple, measurable effects in red, multiple cell symbols signify hyperproliferation/increased presence of the particular cell type, cast dice symbols represent increased chance of a mutagenic event occurring and the warning sign symbolizes an acquired mutation that has occurred. Refer the ‘Discussion' section in text for detailed explanation.

Comment in

Similar articles

Cited by

References

    1. Akashi K, Traver D, Miyamoto T, Weissman IL. A clonogenic common myeloid progenitor that gives rise to all myeloid lineages. Nature. 2000;404:193–197. - PubMed
    1. Al-Kasim F, Doyle JJ, Massey GV, Weinstein HJ, Zipursky A. Incidence and treatment of potentially lethal diseases in transient leukemia of Down syndrome: Pediatric Oncology Group Study. J Pediatr Hematol Oncol. 2002;24:9–13. - PubMed
    1. Alford K, Slender A, Vanes L, Li Z, Fisher EM, Nizetic D, et al. Perturbed hematopoiesis in the Tc1 mouse model of Down Syndrome. Blood. 2010;115:2928–2937. - PMC - PubMed
    1. Bahn S, Mimmack M, Ryan M, Caldwell MA, Jauniaux E, Starkey M, et al. Neuronal target genes of the neuron-restrictive silencer factor in neurospheres derived from fetuses with Down's syndrome: a gene expression study. Lancet. 2002;359:310–315. - PubMed
    1. Bercovich D, Ganmore I, Scott LM, Wainreb G, Birger Y, Elimelech A, et al. Mutations of JAK2 in acute lymphoblastic leukaemias associated with Down's syndrome. Lancet. 2008;372:1484–1492. - PubMed

Publication types

Substances